

Dow Lecture by Philip R. Lane, Member of the Executive Board of the ECB, at the National Institute of Economic and Social Research
London, 16 February 2023
Introduction
It is an honour to deliver this year’s Dow Lecture. Christopher Dow had a distinguished career as an applied macroeconomist, both in the United Kingdom (at the Bank of England, the Treasury and here at NIESR) and internationally (as OECD Chief Economist from 1963 to 1973).[1] Moreover, he extensively analysed my topic today – the impact of interest rate movements on the financial system, the economy and inflation – including in the context of the cost-push inflation pressures of the 1970s and 1980s.[2] While the current inflation environment is quite different in many respects – having been driven predominantly by extraordinary external factors such as the COVID-19 pandemic, supply bottlenecks and energy shocks – much can still be learned by re-visiting the analysis by Christopher Dow of the macro-financial dynamics and policy challenges associated with cost-push inflation.
My aim today is to provide an interim analysis of the ECB’s current policy rate tightening cycle.[3] I will first describe the projected impact of monetary policy in the range of macroeconomic models maintained by the ECB. Next, I will report on the accumulating evidence about the impact of the policy tightening cycle on the financial system, the economy and inflation. In view of the long and differential lags in the transmission of monetary policy, this evidence is necessarily partial and of an interim nature. Still, it is essential to monitor closely the incoming evidence, since the efficient calibration of monetary policy must take into account the feedback loops between monetary policy, the financial system, the economy and inflation.
Beginning in December 2021, the ECB unwound its highly accommodative monetary policy stance in several phases. First, the pace of net asset purchases was reduced, including through the ending of net purchases under the pandemic emergency purchase programme in March 2022. Net asset purchases under the asset purchase programme further shifted down from April 2022 and concluded in June 2022. In July 2022, we began raising the ECB key interest rates. The €STR forward curve – the benchmark for key overnight lending in the euro area – began shifting up in December 2021, as markets began pricing in the start of ECB policy normalisation. This induced a tightening impulse even before we began raising actual policy rates.
The speed and the scale of the back-to-back rate adjustments since July stand out in the history of the monetary union (Chart 1). By now, we have raised rates by a cumulative 300 basis points, bringing the deposit facility rate – which, in the current conditions of ample excess liquidity, constitutes the main instrument for steering the monetary policy stance – to 2.5 per cent. Furthermore, we have also signalled that we intend to raise the deposit facility rate by another 50 basis points at our March meeting and we will then evaluate the subsequent path of our monetary policy. This evaluation will necessarily turn on two basic considerations: first, an updated assessment of the medium-term inflation outlook (both the modal path and the risks to this outlook) second, an updated assessment of the appropriate monetary policy stance to make sure that inflation returns to our two per cent target in a timely manner. In turn, both parts of this assessment involve judgements on the impact of the monetary policy adjustments that have already occurred since December 2021.
Chart 1
Changes in the key ECB policy rates
(percentage point changes)
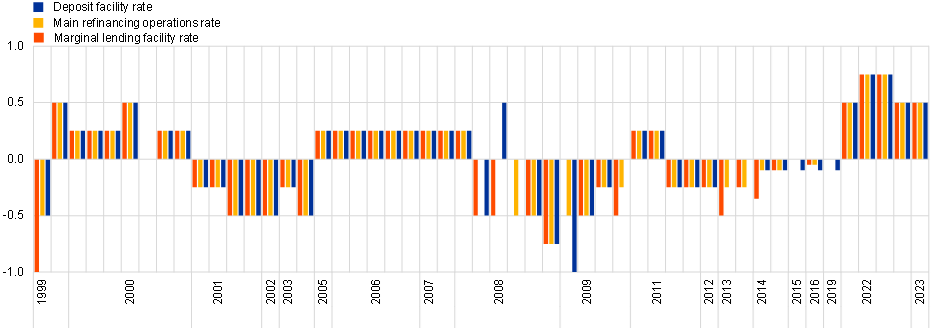
Source: ECB.
Note: The latest observation is for 8 February 2023.
Calibrating changes in the policy stance and monitoring the transmission to the financial system, the economy and inflation presents policymakers with three challenges. The first is to produce a reasonable (counterfactual) forecast of where inflation would head without an adjustment in monetary policy. The second is to develop reasonable estimates of how an adjustment in monetary policy would alter that inflation trajectory. The third is to carefully monitor each step in this transmission from monetary policy to the economy and inflation, gathering evidence along the way on how this transmission conforms with past regularities or, if it does not, to better understand how and why the specific features of the current macro-financial environment might alter the strength and speed of monetary policy transmission. It is worth pointing out that, regardless of the origin of an inflation shock, the working assumption is that monetary policy operates on the demand side, with rate hikes reducing inflation through the dampening impact of tighter financing conditions on the level of aggregate demand. Nevertheless, watching for heterogeneities in the transmission across sectors and analysing the potentially considerable and state-dependent lags in the transmission is essential and I will return to this point throughout this lecture.
In this lecture, I will leave the question of forecasting aside and focus on the latter two points: how to form a view on the typical transmission regularities, and how to cross-check them against the incoming data along the way.
Let me first review the set of models that ECB staff use to inform policy decisions and present the macroeconomic effects these assign to monetary policy. As the bulk of these effects on the economy and inflation are expected to materialise only over the coming two to three years, I will then go through a set of more timely signals that may be gathered along the way and that can act as checkpoints on the path of transmission.
To date, these signals for the most part point to a strong and orderly transmission of the ECB’s policy tightening to the relevant financial and real variables. But, especially since this transmission process is still unfolding, I will conclude with a set of open questions on the impact of the ongoing policy tightening that can only be settled conclusively at a more mature stage of the process.
The impact of hiking in macroeconomic models
At the ECB, we employ a suite of semi-structural, dynamic stochastic general equilibrium (DSGE) and Bayesian vector autoregression (BVAR) models to study the underlying transmission channels of monetary policy and to quantify the impact of changes to monetary policy on financial conditions, the economy and inflation. Drawing on a suite of models, rather than relying on a single framework, helps us draw more robust policy conclusions.
It is inherently difficult to pin down causal relations in empirical macroeconomic models and this is reflected in the wide range of estimates of the impact of monetary policy impulses on macroeconomic variables. The level of uncertainty about the impact of monetary policy is arguably greater for the euro area than for other economies, in view of the structural changes associated with the formation of the monetary union in 1999. Given this high uncertainty across models, we employ different classes of models, supplement the main models with satellite models, and add various other sources of information.
Let me now turn to some of the main models that we use and discuss how these differ in terms of their design.
The ECB-BASE model, which is similar in structure to the US Federal Reserve’s FRB/US model, is a large-scale semi-structural model that is used primarily for forecasting and policy simulations.[4] This type of model is designed to strike a balance between having strong theoretical foundations embedded in its steady-state properties and being flexible enough to be useful for a vast range of policy simulations. In particular, the semi-structural approach typically relies on a series of reduced-form equations that govern the relations among the key macroeconomic variables and allow flexibility to match the empirical data.
In addition, several structural DSGE models are regularly used in our internal quantitative policy analysis. In particular, the extended version of the New Area-Wide Model (NAWM II) is a fully micro-founded model that incorporates explicit intertemporal substitution via a forward-looking Euler equation for optimising households, a financial accelerator mechanism linking bank lending to the net worth of firms, interest-sensitive investment decisions of households and firms, and an exchange rate channel.[5] Most recently, the MMR model has been developed, which is a DSGE model sharing many similarities with the NAWM II, but which additionally estimates the degree of attention to central bank communication, thereby dampening the forward guidance puzzle encountered in standard DSGE models, and accounts for a time-varying neutral interest rate in line with the trend visible in the data over the last decades.[6]
Our modelling toolkit also includes several Bayesian VAR (BVAR) models.[7] This class of models is regularly used for forecasting and policy analysis in major central banks and international institutions.[8] Due to their ability to capture the inertial behaviour of inflation and the persistence in aggregate variables, BVAR models provide a useful benchmark to evaluate structural and semi-structural models both in terms of their forecasting performance and for what concerns the monetary policy transmission mechanism.[9]
In general, DSGE models (NAWM II and MMR) and BVAR models display a stronger impact of monetary policy on the economy than semi-structural models (ECB-BASE).[10] There are two main reasons for this. First, the identification of monetary policy shocks is typically clearer in structural models (either DSGE or structural VAR models), allowing for a narrower causal interpretation of the effects of monetary policy. This is important, since reduced-form estimates of the relations between interest rates, economic activity and inflation are plagued by the reverse causality syndrome by which, especially if demand shocks predominate, an increase in interest rates is most likely if economic activity is projected to be strong and inflation to be high. This gives rise to time-series correlation patterns by which any causal dampening impact of monetary policy on activity levels and inflation can be obscured in the data by its proximity to the strong activity and inflation data that actually triggered the policy tightening. In contrast, a structural approach in which the causal impact of monetary policy can be identified should, in principle, uncover the impact of policy tightening on activity and inflation.
Second, the micro-foundations of the optimisation decisions that form the key foundations of these structural models, and the use of model-consistent expectations, lead to more forward-looking behaviour of economic agents compared to other models, and this in turn strengthens the expectations channel of interest rate policy. This explains the stronger initial impact of monetary policy compared to other types of models.
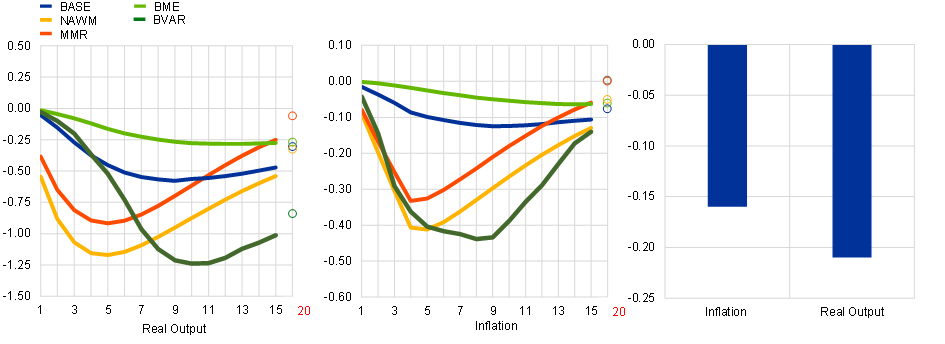
The left and middle panels of Chart 2 show the impact of a policy tightening of 100 basis points on inflation and GDP in these models.[11] Chart 2 also shows that impact of policy tightening derived from the Basic Model Elasticities (BMEs) exercise conducted jointly by the Eurosystem. The BME exercise is a euro area aggregation of simulation results provided by national central banks: these simulations are based on smaller, country-specific models that compute impulse responses of endogenous variables to exogenous shocks, linearised around a specific baseline.
All simulations are based on a tightening that has a relatively persistent effect on short-term rates. Conditional on a 1 percentage point change in the interest rate, on average inflation declines by around 0.3 percentage points and the output gap by 1 percentage point at the peaks of the respective impacts.[12] However, the range of estimates is large: the impacts on inflation and output are larger in structural models (DSGE and BVAR) compared to the ECB-BASE model and the BMEs.[13] Moreover, due to their forward-looking nature and amplification through financial channels, the effect is frontloaded in DSGE models compared to other models, since households and firms more quickly react to the expected declines in future activity and inflation associated with monetary policy tightening. In contrast, the muted initial response in the ECB-BASE model and the BMEs can in part be related to the strong backward-looking expectations formation process in these models.[14]
These estimates imply that the models generate not only different scales of monetary policy impacts but also heterogeneous lags in the timing of the transmission of monetary policy to the economy and inflation. Differences in transmission lags of monetary policy across these models arise from the specific modelling frameworks. In empirical VARs, the persistence is generally driven by the estimated autoregressive processes, in addition to the identification assumptions which impose some ordering of the flow of causality. In DSGE models, inertia is built in via microfoundations, with frictions such as habit formation in consumption, sticky or backward-looking wage and price setting, and adjustment costs in investment. Finally, semi-structural models use a combination of these empirical auto-regressive processes and economic frictions.
In addition to the lags associated with the slow and staggered adjustment of investment and consumption to changes in financial conditions, the full impact of policy rates on financial conditions is not immediate. In particular, fixed-rate loans and deposits provide some near-term insulation to changes in interest rates. However, as financial contracts expire, more and more firms and households face higher interest rates and the tightening of financial conditions is further amplified by the endogenous shortening of maturities in response to higher interest rates. This will be a recurring theme in this lecture, in particular when I turn to how the current tightening is being transmitted.
Finally, our overall policy stance is also affected by our balance sheet polices. Our models suggest that reducing our asset portfolio by a normalised cumulative €500 billion reduction over 12 quarters contributes to lowering inflation by 0.15 percentage points and output by 0.2 percentage points (Chart 2, right panel).
Tightening so far according to model estimates
Our models indicate that the significant policy tightening that we initiated in December 2021 has had substantial effects on euro area financing conditions so far, while its transmission to real activity and inflation is also starting to materialise. In discussing the transmission of our policy stance through the lens of our models, it is important to account for all factors driving that transmission collectively, including interactions with other domestic and global shocks potentially shaping macroeconomic dynamics. These factors jointly shape the magnitude and timing of the transmission to the economy. To disentangle these effects, the impact of policy normalisation is estimated by first computing the policy contribution to changes in financial conditions and then using macro models to estimate the impact on the economy and inflation.
Combining information from model-based analysis and market and survey-based information, we estimate that the tightening of monetary policy has contributed to an increase in short-term interest rates of 90 basis points in 2022, rising to around 300 basis points in 2023 and 2024, and 240 basis points in 2025, and to increases in long-term rates of around 130 basis points.[15]
This tightening is estimated to have already lowered inflation by around 0.2 percentage points in 2022 (Chart 3).[16],[17] The considerable lags between monetary policy actions and their impact on inflation, however, imply that most of the effects are only expected to materialise from 2023 onward. The impacts on GDP growth, however, occur much sooner across most models, with the peak effect expected this year. Inflation is estimated to be around 1.2 percentage points lower in 2023 and 1.8 percentage points lower in 2024 as a result of the tightening, while the negative impact on real GDP growth is estimated to be around 1.5 percentage points on average over the three years. These are sizeable effects. At one level, these estimates serve to underline the severe risks to the delivery of our medium-term target if monetary policy had been passive and had not reacted to the inflation shock. At another level, especially taking into account the wide range of estimates across the different models, material and persistent errors in the appropriate calibration of monetary policy pose two-sided risks to the delivery of our medium-term inflation target: insufficient tightening would result in inflation persistently above our target, while excessive tightening could see overshooting and a return to persistently below-target inflation. These alternative scenarios also entail substantially different profiles for the level of economic activity and, by extension, the labour market.[18]
Chart 3
Impact of policy tightening so far
(year-on-year percentage points)
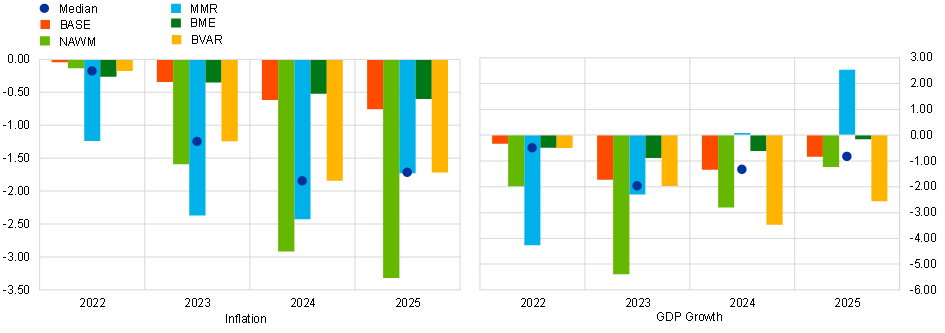
Sources: ECB staff calculations.
Notes: The charts show the impact of changes in short- and long-term interest rates due to policy normalisation since December 2021 computed in ECB-BASE, New Area Wide Model II (NAWM II), MMR model, standard projection-based tools (BME), and a large scale BVAR model including both macro and financial variables The latest observations are for25 Nov 2021 and 23 Nov 2022.
Model-based analysis also facilitates the building of a more detailed understanding of the transmission of policy rate hikes to different components of demand. For example, recent staff analysis employing the semi-structural ECB-BASE model shows that rate hikes may induce stronger investment declines if the initial level of the policy rate is particularly low, as was the case prior to the start of our hiking cycle in July 2022.[19],[20] This result is in line with standard asset price models based on the user cost of capital, which posit a non-linear, negative relation between the level of lending rates and asset prices. Hence, in the case of business and housing investment, lower interest rates lead to larger discounting effects on future returns (dividends and imputed rents), amplifying the impact of interest rate changes on current stock and house prices.
In these simulations, shocks to lending rate spreads and risk-free rates entail a stronger reaction of both business and housing investment in the low-rate environment (0.6-0.7 percentage points and 0.4-0.5 percentage points, respectively) by 2024, compared to a scenario with higher initial levels of lending rates (Chart 4, solid bars). The model simulations confirm a role for state-dependence as obtained from non-linear local projections models.[21] However, relative to such an empirical exercise, the ECB-BASE model suggests the presence of small non-linearities, especially affecting business investment (Chart 4, dashed bars).
Chart 4
Model estimates of impact of rising lending rates on private investment
Business investment (left panel) and housing investment (right panel)
(percentage deviation from baseline/steady-state level)
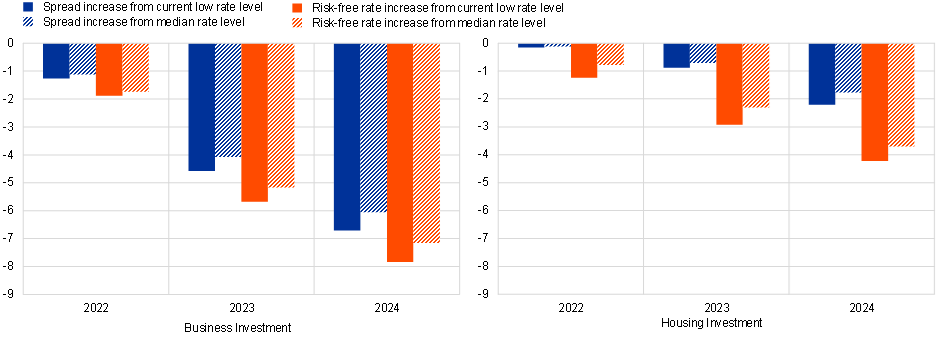
Sources: ECB-BASE simulations and ECB staff calculations.
Notes: Left panelshows the response of business investment to an increase of 100 basis points in corporate rates sustained over the projection horizon. Right panel shows the response of housing investment to a n increase of 100 basis points in mortgage rates sustained over the projection horizon. Spread increases are simulated under exogenous monetary policy. The risk-free rate scenarios assume short- and long-term interest rates to increase by 100 basis points, without spread increases, and are allowed to trigger an exchange rate adjustment that amplifies the negative impact of rising rates.
Finally, all model-based quantitative estimates are surrounded by significant uncertainty, inter alia because these models are calibrated to reflect historical regularities that may not apply to the prevailing conditions. Also, while the models provide a good estimate for the overall effects of policy changes on the economy and inflation, policy transmission usually unfolds in a heterogeneous manner, with the peak impact and duration of transmission varying substantially across sectors and jurisdictions. Consequently, the broad orientation delivered by the macroeconomic models needs to be complemented by a more granular set of analytical checkpoints that allow us to ascertain whether the responses to our policy measures are moving in the right direction and at the right pace. I now turn to this more granular and data-driven analysis.
Tightening impact according to market and survey information
In line with the sequence by which monetary policy passes through the transmission chain, I will start with the impact on short-term money market rate expectations.
Market rates
A first indicator is the extent to which moves of our policy rates influence money market conditions. The evidence suggests that the policy rate hiking that has occurred since July last year has been passed on almost entirely to short-term money market rates, with the transmission occurring relatively smoothly across market segments and jurisdictions.
Moreover, the response of short-term money market rates has fed through to longer maturities. The €STR forward curve, which is derived from the overnight interest rate swap curve and reflects the market view on the path that the overnight interest rate will follow in the future, has shifted upwards significantly since December 2021 (Chart 5).
Chart 5
€STR forward curve and Survey of Monetary Analysts (SMA) expectations on the deposit facility rate (left panel); Median DFR expectations (right panel)
(percentages per annum)
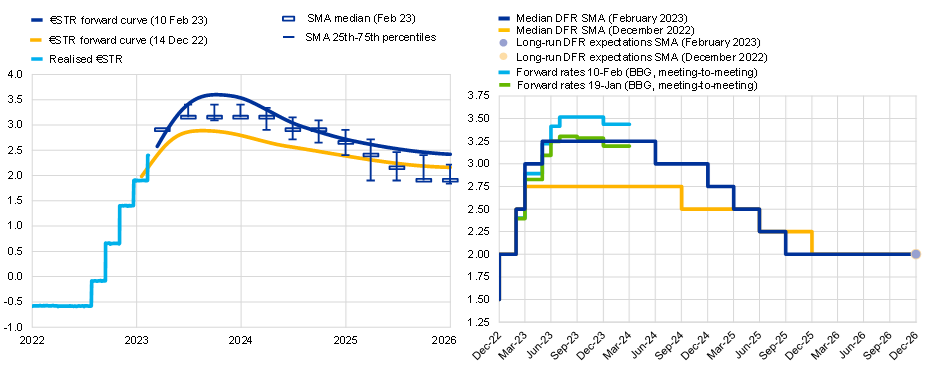
Sources: Left panel: SMA, Refinitiv and ECB calculations; right panel: February 2023 SMA, December 2022 SMA and Bloomberg
Notes: Left panel: The bars depict the median of responses to the February SMA survey on expectations of future deposit facility rates. Surveys are adjusted for the spread between the latest €STR and the DFR observations; Right panel: Maximum number of respondents is 41 for February 2023 SMA and 29 for December 2022 SMA. The Bloomberg meeting-to-meeting (M2M) forward rate depicts the market-based expectations for all future Governing Council meetings which are currently announced until February 2024.The latest observations for the left panel are February 2023.
Whether adjusting for risk premia or not, forward rates today see a rate trajectory which, in line with our communication, rises above the range of estimates that can be considered neutral to the monetary policy stance. Conceptually, the neutral interest rate is the hypothetical level of the interest rate that, when all temporary shocks have faded out, can set the economy on a sustainable path of balanced growth with inflation durably at target. As actual rates move beyond that level, policy becomes restrictive – as is necessary when inflation is otherwise set to remain above the central bank’s target for an extended period.
That is, the monetary policy adjustment since December 2021 can be interpreted as having two elements. First, there has been an exit from an accommodative stance: this component can be viewed as essentially permanent (in the absence of a new anti-inflationary shock). This is reflected in the market pricing of the forward curve, which sees the policy rate settling around 2 per cent once inflation has stabilised at our target, rather than reverting to the low (indeed, negative) levels that were in place until last July. This long-term exit from the persistently low-rate regime reflects the reanchoring of long-term inflation expectations at our 2 per cent target and the market judgement that the anti-inflationary forces that were in place before the pandemic (such as significant deleveraging by both the private sector and the public sector after the 2008-12 financial crises and favourable global supply-side developments) will not return with the same force. Accordingly, a significant component of the rate tightening so far is essentially permanent in nature. While the associated reanchoring of inflation expectations means that the rise in real rates is less than the rise in nominal rates, the permanent nature of this component of the rate tightening amplifies its impact compared to a purely temporary increase in rates.
Second, there is an adjustment component that reflects our monetary policy response to the current high inflation. It is fully priced (in line with our expressed policy intentions) that the main policy rate (the DFR) will reach 300 basis points in March, and it is priced to rise even higher subsequently. This component (going beyond the policy rate of around 200 basis points that the market expects to prevail over the long term) can be viewed as restrictive and further adds to the tightening of financial conditions, even if it is less persistent than the normalisation component of our policy adjustment.
Sovereign bond yields, which play an important role as a key reference for bond pricing, have also shifted upwards and moved largely in lockstep with the OIS curve. The transmission of rate hikes to sovereign bond markets since the start of the hiking cycle since July has been orderly, supported to some extent by the ongoing flexible reinvestment of the pandemic emergency purchase programme, activated in early July 2022, as well as the addition of the transmission protection instrument to our toolkit in late July 2022.
Finally, the euro exchange rate constitutes a key metric of financial conditions that is available at high frequency. It is also a material driver of economic activity and inflation through a range of channels. Reflecting an earlier and more demand-driven updrift in inflation, US monetary policy changed course earlier than in the euro area, which was then also reflected in a sustained euro depreciation against the US dollar, lasting until September of last year. But as the actual and prospective interest rate differentials across the two economies were reduced, the euro has reversed some of the previous depreciation, thus confirming the functioning of another important transmission channel for the current tightening cycle (Chart 6).
Chart 6
EUR/USD, EUR and USD effective exchange rate
(left scale: USD per EUR, right scale: index – 01/01/2018=100)
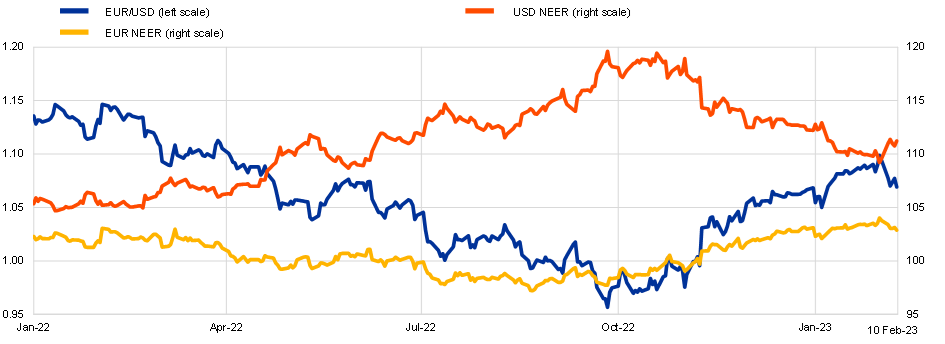
Sources: ECB and ECB staff calculations.
Notes: Nominal effective exchange rate for 41 trading partners.
The latest observations are for 10 February 2023.
Bank-based transmission
The capacity of a central bank to influence the economy hinges on its ability to alter the broad monetary stance, including the terms and conditions at which the economy has access to bank-provided and market-provided finance.[22]
Bank funding costs are rising fast, and the tighter borrowing conditions that banks face today to refinance their assets are reflected in higher lending rates to firms and households. Yields on euro area bank bonds have increased by more than 300 basis points since December 2021. The higher funding costs for banks are being passed on to borrowers. For firms, the cost of borrowing from banks started trending up in early 2022 and has strongly accelerated since September, bringing it to around 3.4 per cent in December (Chart 7, left panel), while the overall cost of debt financing, which also includes the cost of issuing corporate bonds, stood at 3.7 per cent. For households, the cost of borrowing for house purchases has increased by more than 160 basis points over the course of 2022, to 2.9 per cent in December, while the rate on loans for consumption and other purposes has risen by more than 160 basis points, to now stand at almost 5.8 per cent (Chart 7, right panel). Rising costs, in turn, have contributed to a sharp reduction in debt financing flows to firms and households (Chart 8).
Chart 7
Cost of debt financing for euro area NFCs (left panel) and households (right panel)
(percentages per annum)
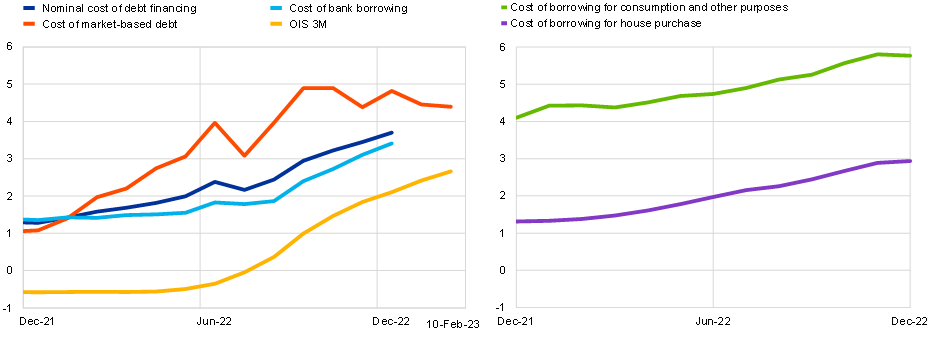
Sources: ECB (MIR, QSA), Merrill Lynch, Refinitiv and ECB staff calculations.
Notes: The latest observations are for December 2022 for the nominal cost of debt financing and bank borrowing and for 9 February 2023 for the cost of market-based debt and OIS.
Chart 8
Debt financing flows of euro area firms and households

Sources: ECB (BSI) and ECB staff calculations.
Notes: MFI loans are adjusted for sales and securitisation, and for firms also for cash pooling. The seasonal adjustment of the net issuance of debt securities is not official. For the household breakdowns, a harmonised adjustment has been made since February 2022, but not for seasonality and not yet published. This implies possible discrepancies between the sum of the breakdowns and the total. The latest observations are for December 2022.
The tighter financing conditions for banks are also reflected in the results of the latest ECB bank lending survey (BLS) from January. Euro area banks reported a substantial further tightening of credit standards for loans or credit lines to enterprises in the fourth quarter of 2022 (Chart 9), especially for housing loans and other lending to households (Chart 10). Consistent with the adverse impact of monetary policy tightening on economic activity levels, risks related to the economic outlook and industry or firm-specific situations are mentioned in the BLS as the main motives currently driving banks towards enforcing tighter credit standards.
Chart 9
Changes in credit standards for loans or credit lines to enterprises, and contributing factors
(net percentages)
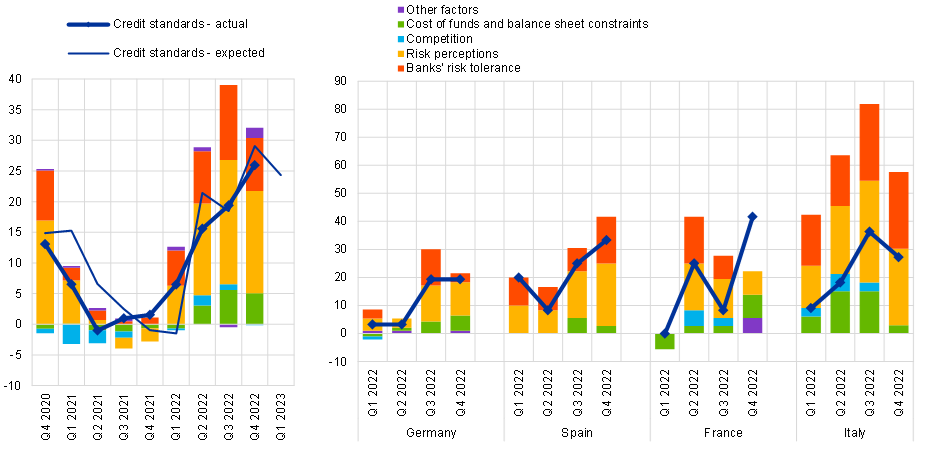
Source: ECB BLS.
Notes: The net percentage refers to the difference between the sum of the percentages of banks responding “tightened considerably” and “tightened somewhat” and the sum of the percentages of banks responding “eased somewhat” and “eased considerably”. Net percentages for the “other factors” refer to further factors which were mentioned by banks as having contributed to changes in credit standards. The latest observations are for January 2023 (BLS).
Chart 10
Changes in credit standards applied to the approval of loans to households for house purchase, and contributing factors
(net percentages)
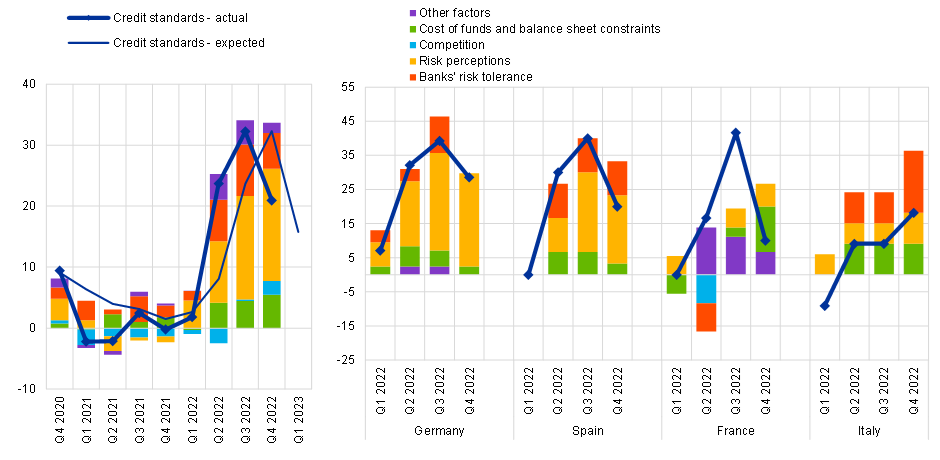
Source: ECB BLS.
Notes: The net percentage refers to the difference between the sum of the percentages of banks responding “tightened considerably” and “tightened somewhat” and the sum of the percentages of banks responding “eased somewhat” and “eased considerably”. Net percentages for the “other factors” refer to further factors which were mentioned by banks as having contributed to changes in credit standards. The latest observations are for January 2023 (BLS).
Survey data for households and firms
More expensive and harder-to-obtain credit is downgrading the prospects of economic sectors that are more sensitive to financing conditions. Survey evidence for consumers and firms signals that the pass-through is ongoing and effective.
For example, consumer expectations about interest rates have shifted upward since March 2022, according to our Consumer Expectations Survey (CES). Consumers have raised their expectations for interest rates on mortgages. The interest rates expected to apply to loans for house purchases in 12 months’ time have increased by about 1.5 percentage points since the beginning of 2022 (Chart 11, left panel). In line with these developments, the CES evidence also points to worsening household perceptions about the housing market, both for perceptions of housing as a good investment and 12-month-ahead expectations for house price growth, amid tightening financing conditions. The share of respondents expecting tighter credit access (for any type of credit) peaked in October 2022 at almost one-third of survey respondents. In parallel, the share of respondents expecting to apply for a new mortgage over the next 12 months declined to 8.9 per cent in October 2022, from 10.3 per cent in April 2022. Understandably in a higher-rate environment, the likelihood of applying for mortgage refinancing (by existing mortgagors) decreased to 12.2 per cent in October 2022, from 18.1 per cent in October 2021 (Chart 11, right panel).
Chart 11
Mean interest rate expectations (left panel), Credit tightness indicators (right panel).
(left panel: percentage, right panel: percentage of respondents)
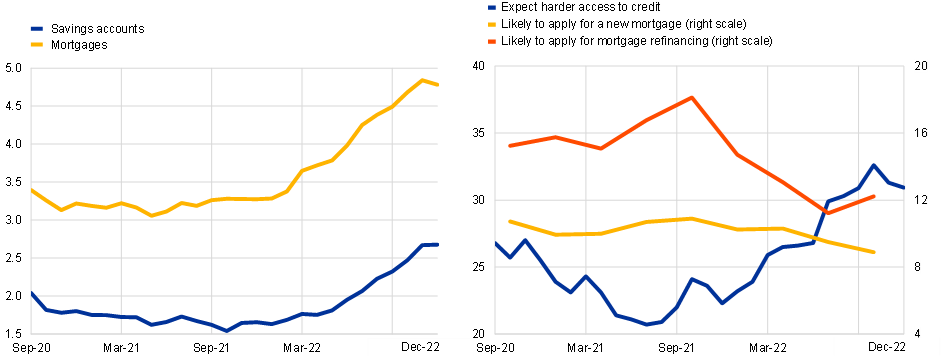
Sources: CES.
Notes: Left panel: Weighted estimates. Mean interest rate expectations for mortgages and savings over time. The question reads: “In 12 months from now, what do you think will be the interest rate on mortgages (on savings accounts) in the country you currently live in?”. The latest observations are for December 2022.Right panel: Weighted estimates. Share of respondents out of all mortgagers who expect i) harder credit access in twelve months’ time (blue line), ii) to apply for a new mortgage (yellow line), and iii) to refinance their mortgage over the next 12 months (red line). The latest observations are for October 2022, and December 2022 for credit access.
Households on an adjustable-rate mortgage – which accounts for roughly 8 per cent of households – are particularly feeling the bite of higher interest rates (Chart 12, left panel). Since July 2022 the share of households reporting that lower interest rates would be best for their household has begun rising, mirrored by a declining share of those preferring higher interest rates since September 2022. The upward trend is particularly visible among households with an adjustable-rate mortgage, who are most directly affected by the rise in interest rates. Conversely, households with a fixed-rate mortgage, who are not as immediately exposed to higher interest rates, hardly changed their attitude towards interest rate changes.
Expectations for spending from respondents with an adjustable-rate mortgage are also more sensitive to changes in expected interest rates. On average, respondents tend to reduce their expected real spending growth when they increase their expectations about future mortgage rates: the typical response to a 1.0 percentage point higher mortgage rate expectation is for households to cut spending by 5 basis points. But the response is in excess of 10 basis points for households on an adjustable-rate mortgage (Chart 12, right panel ).
Chart 12
Household preferences for interest rates (left panel), Impact of expected mortgage rates on expected consumption (right panel).
(left panel: percentage of respondents, right panel: elasticities)
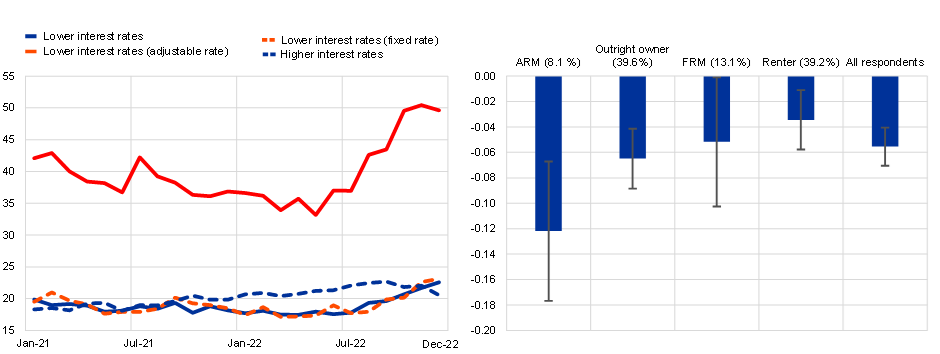
Sources: CES.
Notes: left panel: the question reads: “In your view, which of the following would be best for your household, 12 months from now? 1) Interest rates go up; 2) Interest rates go down; 3) Interest rates remain the same; 4) Interest rate movement would not make a difference. Right panel: ARM stands for “adjustable rate mortgage”. FRM stands for “fixed rate mortgage”. The panel estimation regresses changes in expectations of real consumption growth on changes in expectations of mortgage interest rates allowing the coefficients to vary by type of household while controlling for unobserved heterogeneity in the panel dimension and expectations about income growth. The bars show the mean coefficient estimates while the whiskers show confidence intervals. The estimation period spans April 2020 to December 2022. Shares of each bucket in the total population are in parenthesis. Latest observations for both panels are for December 2022.
Overall, the CES evidence suggests that consumers are incorporating the impact of higher interest rates in their economic decisions, particularly in calibrating their plans for discretionary consumption. This is to some extent already visible in the incoming hard data. Demand for consumer durables is contracting as is the demand for residential construction, driven by rising input costs and interest rates. Even if demand for non-durables should be relatively less affected by rising interest rates, retail sales dropped markedly by 2.7 per cent in December month on month, and by 2.8 per cent in annual terms (Chart 13). Overall, euro area retail sales followed a slightly negative trend in 2022, driven mainly by developments in Germany, Italy, the Netherlands and, more recently, France.
Chart 13
(index; February 2020=100)
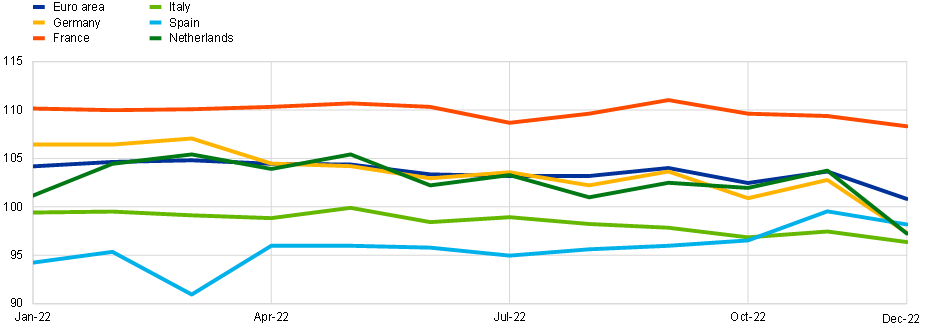
Sources: Eurostat and ECB staff calculations.
Note: The latest observations are for December 2022.
Recent evidence from firm surveys provides a broadly consistent picture of rising financial constraints beginning to restrict production levels. The European Commission’s business and consumer surveys suggest that the share of firms in the manufacturing sector reporting that financial constraints are a factor limiting production has doubled to 6 per cent since the start of our policy tightening (Chart 14, left panel). This information for the manufacturing sector is broadly consistent with responses from the latest Survey on the Access to Finance of Enterprises (SAFE), where a rising share of firms reported “access to finance” as being a very important problem for their business (defined as a score of at least seven on a scale from one to ten) compared with other potential problems (Chart 14, right panel).[23] Given the lags in transmission, a further weakening could be expected over the coming quarters.
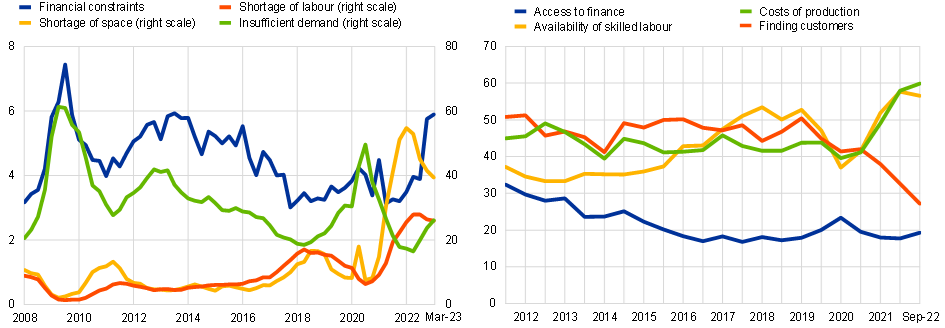
Inflation expectations
Inflation expectations anchor inflation dynamics and co-determine real interest rates. A basic task for monetary policy is to make sure that longer-term inflation expectations align with our 2 per cent target. In addition, deviations from the target will be more prolonged and more costly if households, firms and market participants come to believe that a central bank is not firmly committed to making sure that inflation returns to the target in a timely manner. In particular, even if long-term expectations remained firmly anchored, even a temporary rise in inflation expectations over the typical monetary policy horizon of one to two years would amplify any initial inflation shock by influencing pricing and wage decisions and, all else equal, by pulling demand forward through a lowering of inflation-adjusted interest rates.
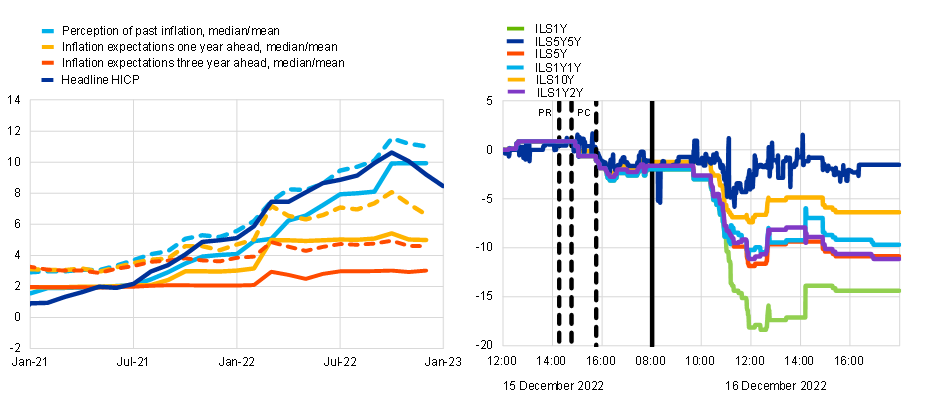
The strong downward sloping ‘term structure’ of inflation expectations in the CES suggests that consumers in the euro area continue to perceive the current spike in inflation as clearly fading out over time. They expect inflation to return closer to the levels seen in the past, albeit to remain above two per cent for some time (Chart 15, left panel). This means that, for a given level of the nominal policy rate, the monetary policy stance is expected to become more restrictive over time as inflation declines.
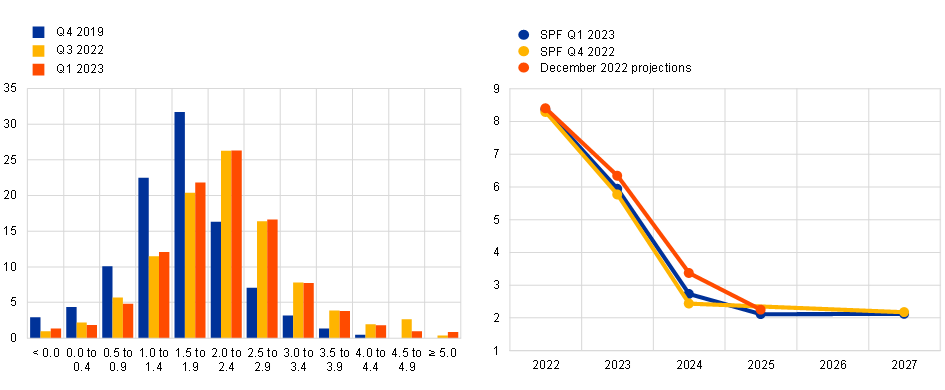
Indeed, measures of long-term inflation expectations from diverse sources – including household surveys, professional forecasters and financial market instruments – have so far remained well anchored around the 2 per cent medium-term target. Respondents to the Survey of Professional Forecasters (SPF) repeatedly, over several rounds, expect inflation to decline steadily over the course this year and next, and to return to target in 2025 (Chart 16, right panel). The distribution of long-term inflation expectations has remained centred around 2 per cent (Chart 16, left panel). Financial market measures of inflation compensation have also hovered around the 2 per cent target over the medium term.
Financial markets responded strongly to the policy decisions taken by the Governing Council in our December 2022 meeting, which made clear that we would raise interest rates into sufficiently restrictive territory in order to make sure that inflation would return to our 2 per cent medium-term target in a timely manner. In particular, the reaction of market-based inflation compensation measures in response to the December communication – which saw a substantial decrease in near-term inflation linked swap (ILS) rates in line with a policy tightening effect while longer-term ILS rates remained relatively stable – is an example of how our monetary policy decisions are contributing to keeping inflation expectations well anchored (Chart 15, right panel).
Chart 15
ECB consumer expectations survey (left panel); Intraday movements of market-based measures of inflation compensations (from inflation-linked swaps) around December 2022 Governing Council meeting (right panel)
(left panel: annual percentage changes; right panel: basis points)
Sources: left panel: ECB CES, right panel: Bloomberg and ECB calculations.
Notes: left panel: Solid/dashed lines represent the median/mean. The latest observations are January 2023 (flash) for headline HICP, December 2022 for the rest. Right panel.: “PR” (the first vertical dotted line) represents the publication of the ECB’s monetary policy press release. The two vertical dotted lines either side of “PC” represent the start and end of the ECB’s monetary policy press conference. The solid black lines represent the opening of markets on the next day. The latest observations are for 16 December 2022.
Chart 16
Aggregate probability distribution for SPF longer term inflation expectations (left panel) and SPF inflation expectations profile (right panel)
(left panel: per cent of respondents; right panel: annual percentage changes)
Sources: ECB.
Notes: Staff Projections (December 2022), ECB Survey of Professional Forecasters.
Transmission compared to previous cycles
The continuous monitoring of transmission is essential to cross-check model predictions against the reality on the ground. But it becomes especially urgent when there is a distinct possibility that prevailing conditions differ in fundamental ways from the historical regularities that are encapsulated in those models.
Three factors may distinguish the current hiking cycle from previous tightening episodes. The first relates to the exceptional speed of the current hiking cycle compared to relevant precedents in recent history. The second relates to structural shifts that may have altered the transmission of a given policy impulse in the euro area. And the third factor is the implications of hiking cycles being synchronised across the major central banks.
The sharpest policy tightening on record
Comparing the current hiking cycle to previous ones is challenging for three reasons. First, the current rate hiking cycle started only six months ago, with the bulk of the pipeline effects still expected to be realised over the coming months and years. Second, in order to understand how monetary policy is filtering through to the economy, it is important to consider not only the level that interest rates have reached today, but also the speed at which these have been raised over a relatively compressed period of time. The cumulative 300 basis point hike since July 2022 is the fastest rate hiking cycle in euro area history. Third, the start of the hiking cycle put an end to an era of negative policy rates and marked the first rate hike since 2011. As the available literature studying negative rates has found, pronounced non-linearities were evident in the relative impact of equally sized rate reductions depending on whether these occurred in positive or negative territory. This means that one may legitimately expect such non-linear effects to also be relevant in moving rates back into positive territory after a long period below the zero line. In other words, the rate hiking cycle may not only differ from those observed in history quantitatively, but also qualitatively.
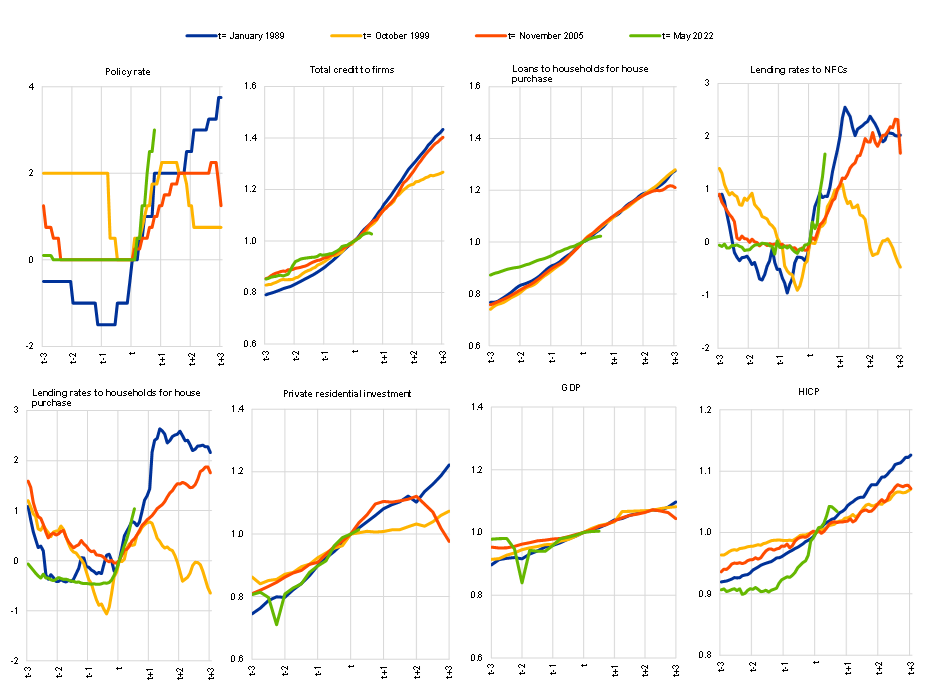
Chart 17 shows that the current rate path outpaces any historical example given in the picture, at least over the earlier phases of progression for which they are comparable. That said, the path is relatively similar to two historical precedents at least (the response by the Bundesbank to the inflationary risks emanating from the German unification in the early 1990s and the rapid normalisation of policy rates by the ECB following monetary union over 1999-2000).
However, at least over the period for which we can draw comparisons, the impact of our rate hikes on lending rates and on credit volumes has been stronger and more rapid. It is interesting to note that, despite following similar trajectories over the period preceding the start of the respective hiking cycles, the evolution of total credit to firms is already showing signs of moderation, whereas it took longer for commercial credit to reach an inflection point in the other two episodes. Of course, whether these tighter conditions will succeed in sufficiently dampening demand and thereby decelerating inflation markedly is too early to conclude and remains an open issue.
Chart 17
Key macro financial variables during hiking cycles.
(cumulative changes in percentage points for policy and lending rates; index (t=1) for the rest)
Sources: ECB, Eurostat and ECB staff calculations.
Notes: The ECB-relevant policy rate is the Lombard rate up to December 1998, the main refinancing operations rate up to May 2014 and the deposit facility rate thereafter. Total credit to firms includes borrowing from banks and debt securities issued by NFCs. Monetary financial institution loans to firms and households are adjusted for sales, securitisation and cash pooling. Data for debt securities and private residential investment before 1989 are not available and have been estimated. The latest observations are for December 2022 for lending rates and loans, January 2022 for HICP, February 2022 for the deposit facility rate, Q3 2022 for private residential investment and Q4 2022 for GDP.
The international dimension
Adding to the extraordinary circumstances, the ECB is not alone in its historic rate hiking cycle. Given the global drivers of the inflation surge (energy shocks, global supply chain bottlenecks), major central banks around the world have simultaneously increased interest rates at an historic pace. The common global factor is also evident in the behaviour of asset prices, with euro area asset prices having become more sensitive to US macro-economic news. Empirically, medium-term spillovers from the Federal Reserve tightening to euro area real activity and inflation are found to be large and, along some dimensions, in fact as large as the effects on the US economy itself (Chart 18). It has been and will continue to be important for central banks in their policy deliberations to not only account for the effects of their own policies but also for those of their global peers.
Chart 18
Estimated impact of US Federal Reserve tightening on industrial production (IP), the consumer price index (CPI), trade, and selected financial asset and commodity prices (in per cent from baseline)
(in % from baseline)
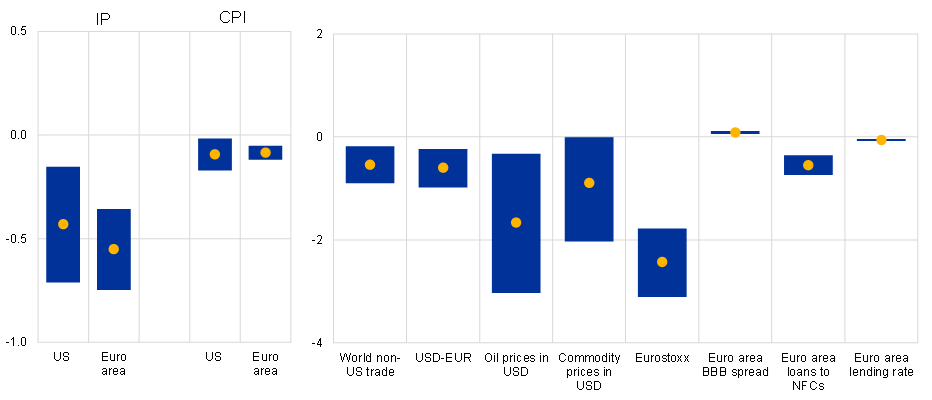
Sources: ECB and ECB staff calculations.
Notes: Yellow dots show point estimate of impulse responses and blue bars 68% confidence bands. The point estimates shown are the maximum/minimum effects over a horizon of 24 months. Estimates obtained from using the high-frequency-based US monetary policy shocks (sum of conventional, Odyssean forward guidance and QE) shocks of Jarocinski (2021) in monthly smooth local projections. Sample period spans 1991 to 2019.
Structural shifts in firm and household financing
Structural shifts are another challenge that compels us to reassess our modelling frameworks and to augment them with further evidence on the evolution of the monetary policy transmission process. One example is the structure of private sector debt. For instance, as policy rates increase, more and more firms can be expected to opt for shorter maturity and flexible rate debt, which could magnify the impact of monetary policy on investment. Firms have already shifted their debt structure away from long maturities. In 2021, about 25 per cent of new loans had a maturity of more than one year, whereas reversion towards levels closer to those observed around 10-15 years ago, characterised by shorter maturities and more recourse to flexible rate debt (Chart 19, left panel). Further shifts might be expected in response to the current rate hiking cycle. Such behaviour could translate into a stronger sensitivity of the interest expenses of firms to monetary policy changes. This in turn means a stronger contraction of corporate cash flows when policy rates increase. Over time, firms that already face financing frictions can be affected more by this “floating-rate channel” of monetary policy, amplifying the conventional monetary policy transmission.
Chart 19
Share of new loans to firms by fixation period (left panel); relation between firms’ default risk and net leverage by debt servicing cost (right panel)
(left panel: share as a percentage of new loans; right panel: x-axis – net debt level as a percentage of total assets; y-axis – expected default frequency in percentages)
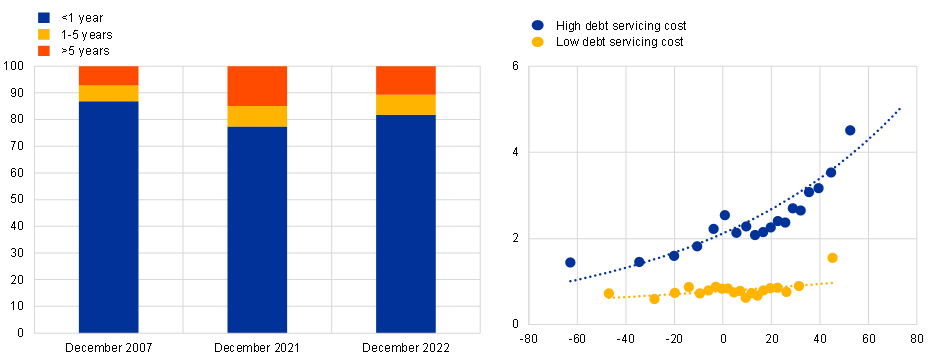
Sources: ECB (MIR), Worldscope, Refinitiv, Moody’s and ECB staff calculations.
Notes: Left panel: the latest observations are for December 2022.
Right panel: high debt servicing costs are those above the median, while low debt servicing costs are those below the median. Net debt is measured as a percentage of value added. The chart is a bin scatter. The latest observations are for Q2 2021.
Financing constraints may also increase amid more elevated debt servicing costs, since default probabilities grow with a decline in expected activity levels and rising interest rates (Chart 19, right panel). Financial intermediaries judge corporates by their probabilities of default and will likely curtail credit for those borrowers deemed to be too risky: a commonly used measure of borrower risk is the one-year-ahead expected default frequencies (EDFs). In line with the Merton-type model underlying the computations, data on individual companies point to a positive relation between EDFs and net leverage. What can also be observed however – at least in some samples examined – is that the sensitivity of EDFs to net leverage also shifts upwards when debt servicing costs increase. This may suggest that an environment of elevated debt servicing costs might also translate into higher probabilities of default and thus potential increases in companies financing constraints.[24]
Moreover, firm financing structures have not only changed in relation to maturity structures, but also in terms of the relative role of different debt instruments. While firm financing remains predominantly bank-based in the euro area, bond financing has increased considerably over the last fifteen years (Chart 20). Prior to the onset of the ECB’s monetary policy normalisation, the share of bonds had reached a peak of about 30 per cent in 2021. Increases in bond financing largely reflected credit supply restrictions: after the great financial crisis and during the ensuing sovereign debt crisis, banks curtailed their credit supply to the economy and large firms used the “spare tyre” of bond markets to finance themselves.[25] Thereafter, developments were helped by corporate bond purchase programmes of the ECB and overall favourable financing conditions.
Chart 20
Ratio of bonds over loans in euro area NFCs
(ratio)
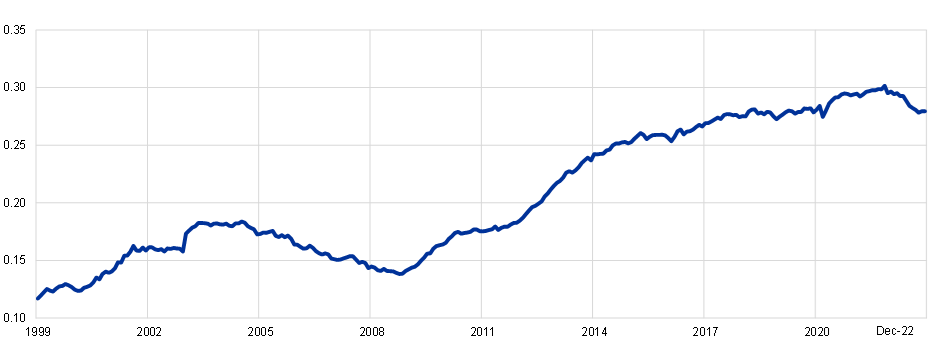
Sources: ECB (BSI, CSEC).
Notes: Data cover NFCs. Loans and bonds are notional stocks. The latest observation is for December 2022.
As firm financing switches from bank to bond financing, the sensitivity of economic activity to changes in the short-term policy rate can decrease, since the higher duration of bonds insulates the stock of debt from rate changes. However, at the same time, the total sensitivity to movements of the long-term policy rate and of overall yield curve might increase, via new issuance. The differences in transmission, whereby firms using more bonds are more directly affected by changes in long-term rates rather than short-term rates, reflects this fact that the typical maturity of corporate bonds is higher than for loans.[26]
Firm financing via bond markets can be fragile in a context of policy normalisation and thereby can amplify de-risking (Chart 21). As the normalisation process of monetary policy started and rates increased across the whole term structure, bond issuance dried up during the course of 2022, thus translating into a decrease in the share of bonds relative to loan. Furthermore, firm-level data suggest that the ongoing monetary normalisation is not neutral with respect to the risk profile of bond issuers, as riskier firms have more vigorously reduced their share of new bonds since June 2022. Given the greater sensitivity of bond markets to risk over this period, the role of banks in financing the economy became more prominent. More recently, the rise in bank lending rates has narrowed the gap between the cost of bond and bank finance, with some high-grade issuers returning to the bond market in January 2023. Finally, a stronger recourse to bond markets also exposes firms more directly to foreign monetary conditions, in view of the spillovers across euro and foreign-currency bond markets (Chart 22).
Chart 21
Changes in share of bonds issued by firm default risk after June 2022
(x-axis: 1-year ahead expected default frequency in percentage points, y-axis: bond flows in percentage points of total new credit flows, changes relative to average January 2019-May 2022)
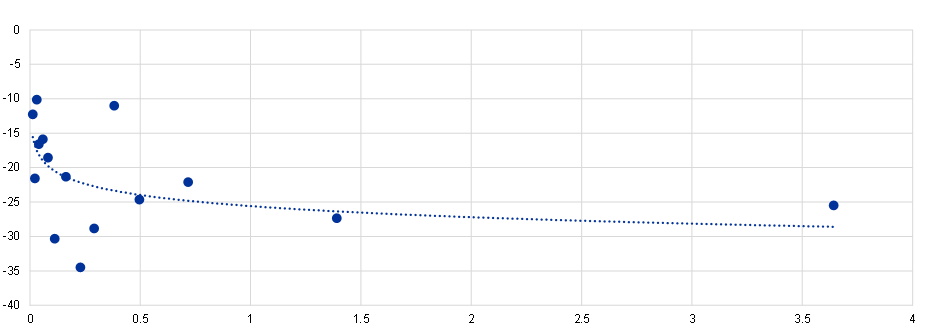
Sources: Moody’s Analytics, Refinitiv, Anacredit, CSDB and ECB staff calculations.
The latest observation is for August 2022.
Chart 22
Bond issuances in euro and non-euro currencies by euro area firms
(EUR billion, moving averages)
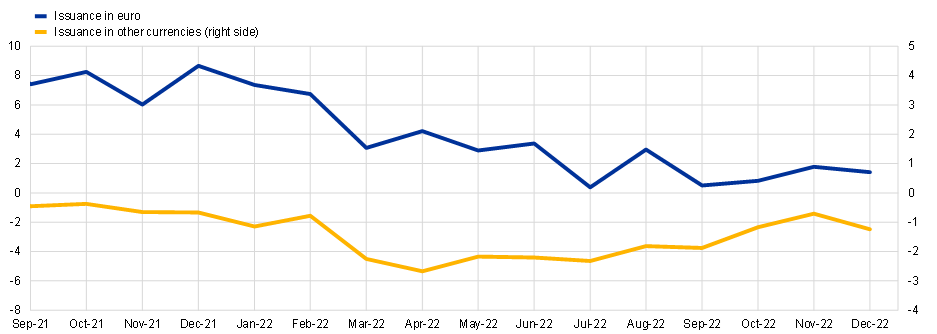
Sources: ECB (CSEC) and ECB staff calculations.
Notes: Data are smoothed using a 7-month-centered window.
The latest observation is for December 2022.
Finally, the change in financing structures has not been restricted to the corporate sector. Households have also begun to increase their recourse to flexible rate mortgages (Chart 23, left panel). Amid monetary policy normalisation, euro area households also tend to be more likely to initiate flexible rate mortgages than in the recent past. Recent empirical work indeed suggests that across euro area countries, those with historically higher shares of flexible rate mortgages also experienced stronger contractions of consumption following a tightening in monetary policy (Chart 23, right panel).[27] A generalised increase in the share of flexible rates of mortgages could thus translate into an amplified monetary policy transmission mechanism to consumption.
At the same time, the significant amount of excess savings amassed by euro area households during the COVID-19 pandemic (Chart 24) will continue to act as a buffer for consumption during this period of high inflation and will exert downward pressure on the price of capital. Both effects could thus dampen the transmission of higher policy rates to the economy and inflation. However, support for higher demand may only be partial: first, a large share of excess savings accumulated during the pandemic accrued to the wealthiest households with a lower propensity to consume and, second, a substantial part of the excess savings is likely to be reabsorbed via weaker borrowing dynamics and – among lower-income households – to finance the price increases for essentials like food and heating. In this context, it is also important to keep in mind that euro area households generally have lower levels of indebtedness than those in the United States, which may explain part of the difference in transmission in the euro area compared with the United States.
Chart 23
Fixed-rate mortgage share and consumption response to contractionary monetary policy shock
(left panel: share of variable mortgages as a percentage of new loans; right panel: x-axis: share of fixed mortgages as a percentage of total new business, y-axis: peak reaction of consumption (percentage) after a 25 basis point tightening of the policy rate)
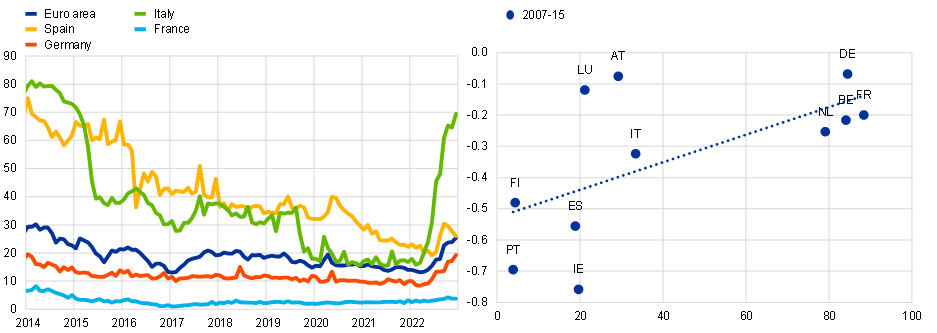
Sources: ECB (MIR), ECB staff calculations and Corsetti et al. (2020).
Notes: The right panel shows peak impacts of monetary policy shock on consumption and average share of fixed mortgages in 2007-15 as reported in Corsetti et al. (2020).
The latest observation is for December 2022.
Chart 24
Household excess savings during the pandemic
(left panel: Household excess savings flows, EUR billions (seasonally adjusted), right panel: Stock of accumulated household excess savings (EUR billions, cumulative increase since 2019Q4)
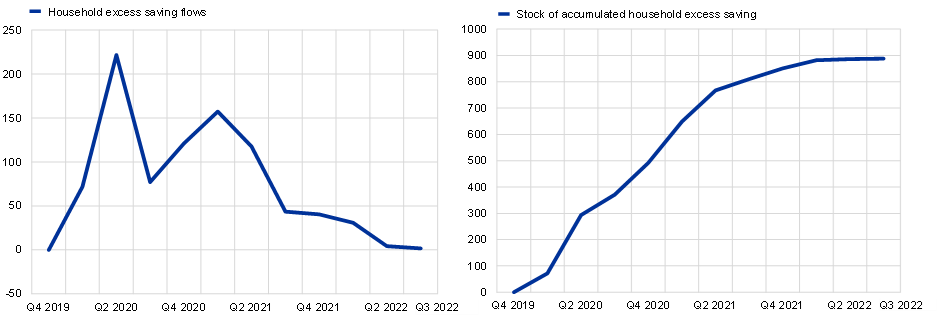
Sources: Eurostat, ECB staff calculations.
Notes: Excess household savings flows are calculated by multiplying the difference between the actual savings rate and the savings rate in 2019Q4 for each quarter by the actual income in each quarter. The latest observation are for the third quarter of 2022.
Structural shifts in the banking system
Another open question is the degree to which the improved capitalisation levels of euro area banks will affect monetary policy transmission.
Against the backdrop of regulatory developments, the launch of European banking supervision and enhanced market scrutiny, the euro area banking sector has become better capitalised and more attentive to the early identification of risks and vulnerabilities. Greater bank capitalisation, in theory, should allow for a smooth transmission of monetary policy to lending conditions, since the risk of a credit crunch as rates increase is reduced.[28] The Common Equity Tier 1 (CET1) ratio of euro area banks has increased substantially since the establishment of European banking supervision (Chart 25). This allowed them to become part of the solution during the COVID-19 pandemic, supporting the euro area economy’s unprecedented need for emergency liquidity lending.
The upgrade in regulatory and supervisory oversight has led to more prudent risk management practices, contributing to tightening credit standards even in periods when the latter were eased on the back of monetary policy accommodation (Chart 26). The decrease in the riskiness of loan portfolios was accompanied by a more efficient unwinding of legacy assets (Chart 27), ensuring that the strengthening of banks’ intermediation capacity was persistent and resilient to adverse developments.[29] Even now in a context of monetary policy tightening, the additional capital buffers and prudential practices cultivated over the past decade act as a natural bulwark against an unwarranted and disorderly deterioration in financing conditions for the real economy.
The experience during the pandemic has also shown that micro and macroprudential policy measures can complement monetary policy, adding to the overall resilience of bank intermediation in the euro area. As euro area banks have adapted to the evolving regulatory and supervisory landscape, monetary policy, micro and macroprudential authorities have refined their understanding and shared experience of how the different policy areas can complement each other to achieve common goals.[30] For instance, there is evidence that capital relief measures at the height of the COVID-19 pandemic increased the effectiveness of targeted longer-term refinancing operations in supporting the flow of bank credit to the real economy.[31]
Chart 25
Evolution of CET1 ratio and capital requirements
(percentages)
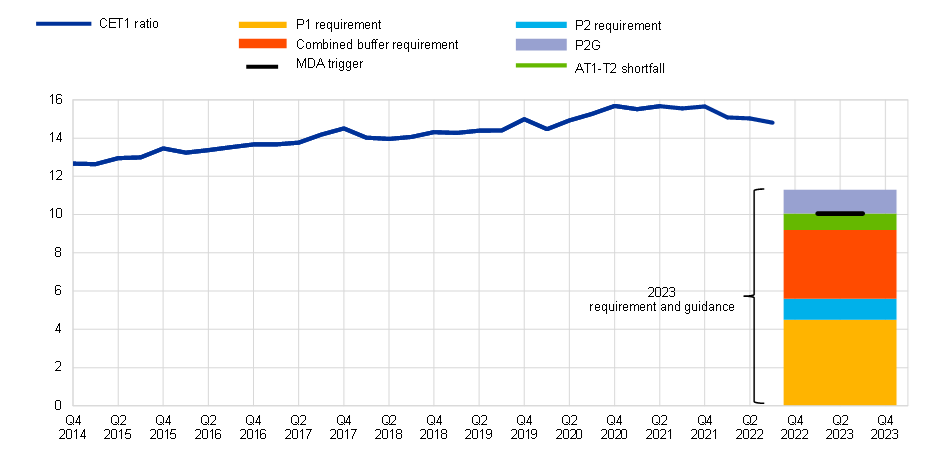
Sources: ECB supervisory reporting and ECB staff calculations.
Notes: CET1 capital ratios are based on data for a balanced panel of 103 significant institutions under the supervision of the ECB. The sample has been adjusted for major M&As. CET1 levels, systemic buffers and CBR (Combined Buffer Requirement) calculation as at the third quarter of 2022. P1 stands for Pillar 1; P2 (Pillar 2) requirement and P2G (Pillar 2 Guidance) are based on the 2022 SREP decisions applicable as of 1 January 2023, based on a sample of 100 banks subject to the SREP. MDA (Maximum Distributable Amount) trigger indicates the level below which banks face restrictions on the amount of distributable profits. Banks must fulfil both P1 and P2R with a minimum of 56.25% of CET1 and can meet the rest with AT1 and T2, with at most 25% of T2. A failure to have enough AT1 or T2 creates a shortfall that banks must fulfil with additional CET1, which is the one displayed in the chart.
The latest observation is for the third quarter of 2022.
Chart 26
NFC credit standards and impact of supervisory and regulatory requirements on credit standards
(net percentages of banks)
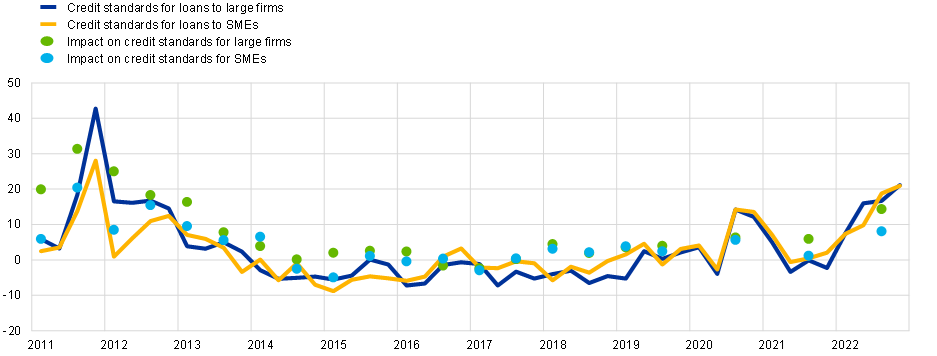
Sources: ECB (Bank Lending Survey).
Notes: Net percentages are defined as the difference between the sum of the percentages of banks responding “tightened considerably” and “tightened somewhat” and the sum of the percentages of banks responding “eased somewhat” and “eased considerably”. The question refers to regulatory or supervisory actions relating to capital, leverage, liquidity, or provisioning that have recently been approved/implemented or that are expected to be approved/implemented in the near future. “SMEs” denote small and medium-sized enterprises.
Latest observation: 2022Q4.
Chart 27
Developments in non-performing loan ratios and probabilities of defaults
(percentages)
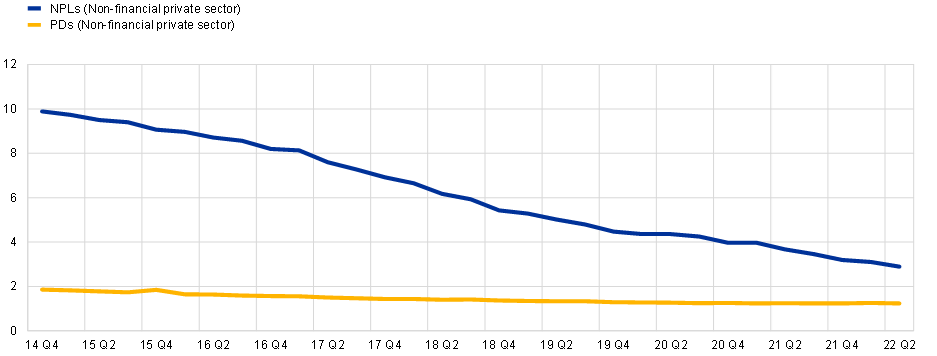
Sources: ECB Supervisory Reporting and ECB staff calculations.
Notes: Based on a balanced panel of significant institutions (92 SIs) under the supervision of the ECB reporting FINREP data on a consolidated basis. The sample has been adjusted for major M&As. Non-performing loans (NPLs) and probability of defaults (PDs) refer to loans to the non-financial private sectors (i.e. non-financial corporations and households).
Latest observation: 2022Q2.
Consolidation and cost rationalisation have contributed to a sustained improvement in bank profitability, increasing the resilience of the euro area banking system and reducing the risks of an uneven transmission of monetary policy. Profitability of the banking sector influences intermediation capacity, the transmission of prudential and monetary policies, as well as the ability of firms to invest in innovative projects.
The evolution of the return on equity (ROE) of euro area banks, except for the drop due to the COVID-19 pandemic, is a testament to the efficiency gains achieved over the past decade, also under the impulse of supervisory authorities and market dynamics that favoured consolidation in the banking sector. In that context, the funding cost relief brought about by monetary policy easing between 2014 and 2021 bought time for banks to improve and adapt their business models to the evolving landscape, leaving them in a more comfortable position when the general level of interest rates started to rise.
A structurally more profitable banking system is inherently more resilient and less dependent on public support measures.[32] In the context of the ongoing monetary policy tightening, this will help to preserve a well-functioning bank-based transmission of monetary policy, reducing the risks that a lower risk appetite of financial intermediaries amid the cooling off of the economy may set the ground for an uneven transmission of monetary policy.
This being said, pockets of vulnerability remain, especially along dimensions that had emerged with the global financial crisis. For instance, despite the improvement in bank profitability, cost of equity measures – the return that investors demand – still lie well above the ROE, reflecting onto persistently low bank valuations (Chart 28).[33]
Chart 28
Developments in price-to-book ratios
(ratio)
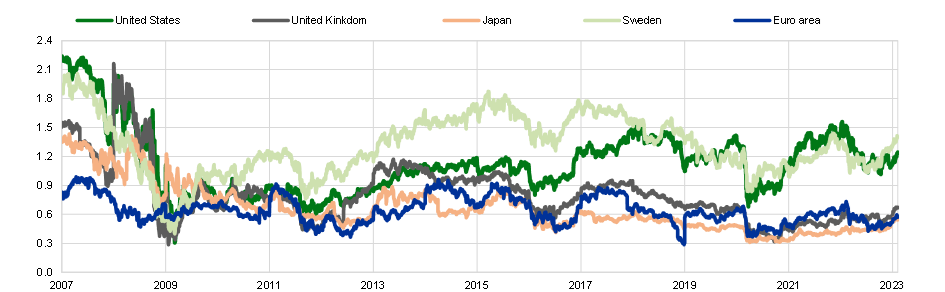
Sources: Refinitiv.
Notes: Price-to-book ratios for the banking sector of selected countries.
Latest observation: 7 February 2023.
Finally, since 2009, the importance of banks in euro area financial intermediation has declined in favour of non-bank financial institutions (NBFIs). Direct lending of NBFIs to the private sector is relatively small in the broad euro area, with notable exceptions concentrated in few countries. But those institutions play a dominant role in holding both sovereign and corporate bonds and their balance sheet has steadily increased since the global financial crisis (Chart 29). Hence, the reduction in the relative role of loans over bonds (Chart 20) has translated since the global financial crisis translated into a diminished importance of banks in monetary transmission compared with NBFIs. Recent research demonstrates that monetary policy transmission via traditional banks and NBFIs differs in non-trivial ways, but remains effective in the face of a changing monetary toolkit and evolving central bank mandate.[34] This has been reflected well in the ECB’s monetary policy strategy review.[35]
Chart 29
Financial assets holdings in the euro area
(EUR trillion)
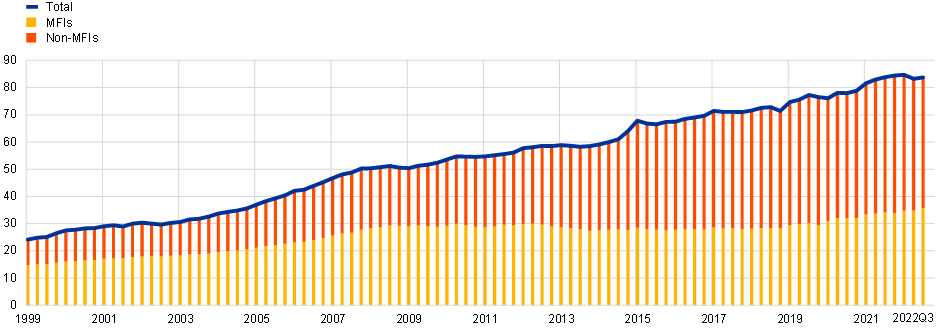
Source: Euro area accounts.
Notes: Non-MFIs include insurance companies and pension funds (ICPFs), investment funds (IFs), and other financial intermediaries (OFIs). MFIs exclude the Eurosystem. Calculations are based on market values.
The latest observation is for the third quarter of 2022.
Structural shifts in the broader economy
Beyond the changes in financing structures, changes to the broader macroeconomic environment in recent years may have an impact on the transmission of our monetary policy.
One example is that a large and growing share of gross value added (GVA) in the euro area is generated in the service sector (Chart 30, left panel).[36] Given the lower capital intensity of services relative to construction or goods production, the service sector may be less sensitive to monetary policy, implying a weaker interest rate channel of transmission. This hypothesis is borne out by recent empirical evidence subdividing regional GVA into its capital- and labour-intensive components (Chart 30, right panel). This breakdown shows that the peak impact of an exogenous change in policy interest rates on capital-intensive output is double the peak impact on labour-intensive output. But the contraction in the latter seems to be more persistent, which, together with complementary pieces of evidence, points to some labour market hysteresis that prolongs the real effects of monetary policy.[37] Whether these patterns have intensified during the years since the COVID-19 pandemic broke out remains an open issue, as the drop in activity in the service sector related to lockdown measures in 2020 and 2021 was largely compensated during the reopening of the economy in 2022. Furthermore, if the increasing role of intangible assets for firm revenues – with a growing role for e-commerce and substantial innovations in the pharmaceutical industry being prime examples – turns out to be a persistent trend, it could support higher interest rate sensitivity, since an increasing role of intangible assets means equity valuations may turn out more sensitive to interest rate changes than in the past.
Chart 30
Share of services in gross value added and sectoral response to contractionary monetary policy shock
(left panel: share of gross value added (GVA) generated in service sector (in per cent), right panel: y-axis: impact of 100 basis point rate hike on regional output in the capital-intensive sector (red) and in the labour-intensive output (blue) at sample mean (in per cent). X-axis: IRF (in years).)
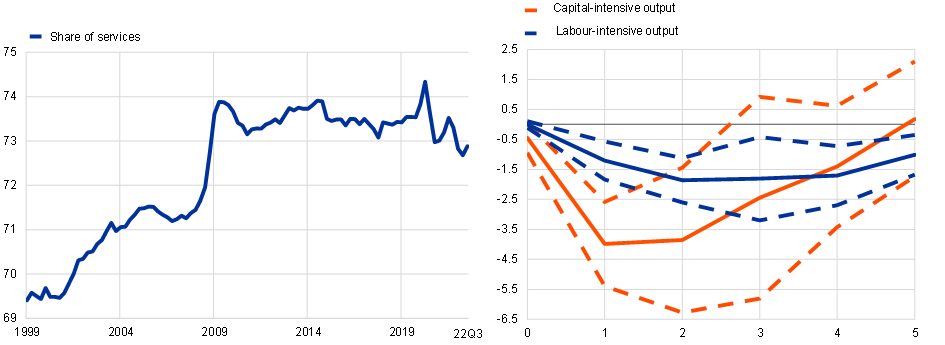
Sources: left panel: Eurostat, ECB calculations. Right panel: Hauptmeier, S., Holm-Hadulla, F., and Nikalexi, K. (2020), “Monetary policy and regional inequality”, Working Paper Series, No 2385, ECB.
The latest observation is for the third quarter of 2022.
Conclusion
In summary, our monetary policy decisions are best served by relying on a broad analytical toolkit. Macroeconomic models provide orientation on how a given monetary policy adjustment should typically affect the economy and inflation, and how the transmission process unfolds, including lags in transmission. But, in tracking the dynamic impact of a policy impulse to its ultimate effects, we also need to constantly monitor progress and update our assessments of how the transmission mechanism is operating under current conditions, with due accounting for the specific configuration of the prevailing financial and economic conditions.
Applied to the current euro area context, this dual approach leads to an interim assessment that our monetary policy actions are clearly tightening financial conditions, reducing credit volumes and altering the behaviour of households and firms.[38] At the same time, much of the ultimate inflation impact of our policy measures to date is still in the pipeline. Over time, our monetary policy will make sure that inflation returns to our target in a timely manner.
But I have also listed some of the sources of uncertainty about the transmission mechanism that call for an open mind about the precise scale of the monetary policy tightening that will be needed to achieve this outcome. Furthermore, as indicated in the introduction, the calibration of the monetary policy stance needs to be regularly reviewed in line with the incoming information about underlying inflation dynamics, especially in the context of the remarkable shocks that have hit the euro area and global economies over the last couple of years. The Governing Council’s data-dependent, meeting-by-meeting approach to setting interest rates is well suited to facilitating the necessary ongoing analysis of these issues.


