Efforts made by the Basel Committee on Banking Supervision (BCBS) to reform financial regulation in response to the global financial crisis (GFC) included introducing regulatory standards for liquidity risk. During the GFC, several banks failed because they had significant maturity mismatches on their balance sheets. These banks did not have sufficient liquid assets to match liability outflows. The ensuing confidence crisis caused a widespread liquidity crunch in the interbank market. In response, the BCBS reformed its regulatory standards, introducing a new measure aimed at ensuring the short-term resilience of the liquidity risk profile of banks.
The BCBS established the LCR standard in 2013. The LCR aims to ensure that banks maintain a liquidity buffer on their balance sheets which can be liquidated quickly during a period of liquidity stress.[1] In particular, the LCR is a forward-looking measure which requires banks to hold a sufficient stock of high-quality liquid assets (HQLA) that can be converted into cash easily and immediately to survive a period of significant liquidity stress lasting 30 calendar days:
The EU implemented the LCR in line with the Basel Framework requirements and applies it to all banking institutions in the EU, by default at both consolidated and individual level. Following a three-year phase-in period, the minimum LCR requirement of 100% came into effect on 1 January 2018.[2]
The March 2023 banking turmoil raised the question of whether the LCR works as intended. The stress scenario in the LCR entails a liquidity shock which is calibrated based on the experience of the global financial crisis. The liquidity shock constitutes a significant – but not worst-case – stress scenario.[3] For example, for stable retail deposits, which on average constitute the largest share of deposits for significant euro area banks, the LCR assumes an outflow rate of 5% for its 30-day liquidity stress scenario. During the March 2023 banking turmoil, actual deposit outflows for the affected banks in the United States (mostly uninsured deposits) and Switzerland (mostly non-financial corporate deposits) were significantly higher than the LCR run-off assumptions for those deposits. As highlighted in Table A, Silicon Valley Bank lost 85% of its total deposits over a two-day period. For First Republic Bank and Credit Suisse, total deposit outflows stood at 57% and 21% respectively over a 90-day period.[4] It should be noted that total deposit outflows as reported by the US and Swiss authorities may not be perfectly comparable with the net deposit outflows available in European banking supervision reporting. Correspondingly, the BCBS is currently examining whether specific features of the Basel Framework, including liquidity risk, performed as intended during the turmoil.[5] This is especially warranted in an environment in which higher and more rapid outflow rates may also be expected in the future due to the digitalisation of banking and the potential sentiment-amplifying impact of social media.
Table A
Cash outflows and selected categories of retail and wholesale deposits, March 2023
|
Bank |
Observed outflow rate |
Period |
|---|---|---|
|
Silicon Valley Bank |
85% |
2 days |
|
First Republic Bank |
57% |
90 days |
|
Credit Suisse |
21% |
90 days |
|
Average (net) outflows for the euro area SIs |
4.2% |
30 days |
|
LCR assumption |
Run-off rate |
Period |
|
Retail stable |
5% |
30 days |
|
Retail less stable |
10% |
30 days |
|
Operational |
25% |
30 days |
|
Non-Financial Corporate |
40% |
30 days |
Sources: BCBS report on the 2023 banking turmoil, BCBS run-off factors and ECB calculations.
Notes: For the column observed outflow rate, for significant institutions (SIs) supervised by the ECB, the value reported is average net outflows of total deposits over March-May 2023.
The LCR is not designed to cover all tail events involving deposit outflows, such as bank runs: instead, it should ensure that banks can withstand a certain liquidity stress scenario. The LCR is designed to be a minimum standard for liquidity risk and has, as such, only limited early warning properties to identify extreme peaks in liquidity stress. Banks are expected to conduct their own internal stress tests to ascertain their required level of liquidity beyond this minimum.
Moreover, some liquidity risks, such as funding concentration or intraday liquidity risk, are not explicitly captured in the LCR, which is why the BCBS has introduced specific liquidity monitoring tools for supervisors. These tools can help supervisors to better assess a bank’s liquidity risk profile, although their availability may vary across BCBS jurisdictions.[6] Supervisors can apply more stringent liquidity requirements under Pillar 2, depending on the bank’s liquidity risk profile.
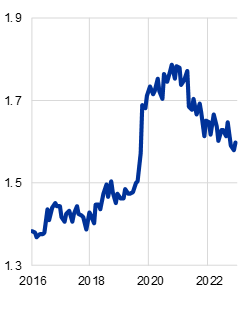
The March turmoil has not resulted in significantly higher outflow rates for institutions covered by ECB banking supervision. Since January 2018, when the LCR came into force in the EU, significant banks’ LCRs stood comfortably above the minimum of 100%. Chart 1, panel a) shows that the average LCR for significant institutions in the euro area has remained above 150% since the coronavirus (COVID-19) period, helping to contain the fallout from recent banking stress in the United States and Switzerland. Following the events of March, contagion fears remained short lived amid solid euro area bank fundamentals. Significant institutions in the euro area did not experience considerably higher net outflow rates since March 2023.
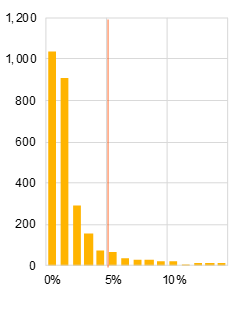
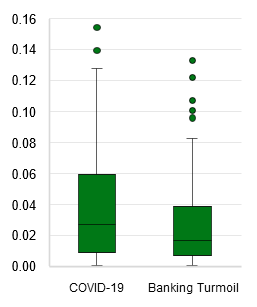
For significant banks supervised by the ECB, the available evidence confirms that the LCR run-off rates covered most significant net deposit outflows during stress episodes between 2016 and 2023. Chart 1, panel b) shows all observed net outflows over the whole observation period for the stable retail deposit class, which is one of the most significant categories by share of total deposits.[7] Since data on gross deposit outflows are not reported in the supervisory statistics, net outflows constitute a useful proxy for gross outflows when net flows are significantly negative, as it can then be assumed that the relative importance of gross deposit inflows is more limited. Around 92% of all observed net outflow rates were covered by the LCR for that category between 2016 and 2023. Further analysis of net retail outflows during stress periods highlights that few net outflows were higher than the corresponding LCR run-off factor, particularly during the COVID-19 period. Some outliers were also recorded for other selected stress periods. Chart A, panel c) shows that the median and the interquartile range (where 50% of net outflows are located) are larger during the COVID-19 period for euro area significant institutions, with more observations above the median. Taken together, these observations call for further analysis of deposit outflows to gain a better understanding of the underlying drivers.
Chart A
LCR and net deposit outflows for euro area banks have both been in line with their respective regulatory thresholds
|
a) LCR over time, 2016-2023 |
b) Observed net outflows – stable retail deposits, 2016-23 |
c) Observed net outflows – total deposits, COVID-19 period and banking turmoil |
|---|---|---|
|
(percentages) |
(y-axis: number of observations, x-axis: net outflows, percentages) |
(percentages) |
 |
 |
 |
Source: ECB calculations on Supervisory Data.
Notes: Panel a: The solid blue line shows the average LCR, where the total amount of deposits considered for the calculation of LCR outflows is used as a weight for aggregation. Panel b: Values are cut at the 97th percentile. Net outflows are calculated as the absolute value of negative monthly relative changes in the stock value of the respective deposit classes. By comparing deposit amounts between month-ends the net outflow rate per deposit is computed (the absolute figures may also include new deposits obtained during the month). The red solid line marks the Basel-calibrated outflow rate for retail stable deposits (5%). Panel c: Values are cut at the 97th percentile. Net outflows are calculated as the absolute value of negative monthly relative changes in the stock value of total deposits. By comparing deposit amounts between month-ends the net outflow rate per deposit is computed (the absolute figures may also include new deposits obtained during the month). The crisis period boxplot pulls together data for the first three months of (i) the COVID-19 pandemic and (ii) the banking turmoil of 2023.
The March turmoil highlighted the impact of tail events for which the LCR has not been designed. The early identification of outliers reflecting tail risks is therefore essential and may require more granular and higher-frequency reporting during normal times. Comparing the net outflow rates during the March turmoil for significant institutions and affected banks suggests that for affected banks the March events may have constituted one of the tail events for which the LCR has not been designed.[8] Consequently, the ongoing discussion should shift towards the need for better supervisory metrics to detect such tail risks. This may require more granular and higher-frequency supervisory reporting and monitoring.
In the EU, ECB Banking Supervision and the national supervisors already have the authority to request additional and higher-frequency reporting from banks for supervisory purposes. Banks located in the EU are required to report the LCR to supervisors on a monthly basis, so data typically refer to the situation at the end of the respective month.[9] However, the supervisor has the option of increasing reporting frequency to weekly, or even daily.[10] As an example of this, ECB Banking Supervision has recently initiated weekly liquidity reporting following the March turmoil. To enhance the pre-emptive and early identification of tail risks, additional supervisory scrutiny could include the more frequent reporting of liquidity and funding data, even in a business-as-usual environment, as well as additional standardised stress indicators to complement the analytical toolbox available to supervisors under Pillar 2.
This box has shed light on the design, purpose and limitations of the LCR and has highlighted the need to gain a better understanding of the behaviour of deposit outflows. The LCR was designed as a minimum requirement to protect banks against potential failure caused by liquidity mismatches in their balance sheets. The LCR should not, therefore, be expected to serve as an early warning tool or a remedy for the type of rapid, extreme deposit outflows observed during the March banking turmoil in the United States and Switzerland. The March events, however, have served as an indication that there could be merit in reviewing and better understanding depositor behaviour. In particular, the use in banking of digitalisation and social media could affect depositor behaviour and might have a longer-lasting effect on run-off rates.
Looking ahead, buffer usability concerns warrant further monitoring to ensure the effective functioning of the LCR framework. While the LCR was not designed to cover tail events, its use as a buffer can provide banks and authorities time to take appropriate actions. However, the BCBS’s report on the lessons learned from the COVID-19 experience provides an indication that banks might, in practice, be reluctant to use their liquidity buffers in times of liquidity stress (i.e. to allow their LCR to fall below 100%).[11] Reasons for such behaviour include potential market stigma, uncertainty about supervisory response or a desire to maintain a certain level of reserves to withstand potential further stress. However, if banks are unwilling to use liquidity buffers this might lead them to engage in exaggerated defensive measures, which could negatively affect the vital services banks provide to the economy.


