


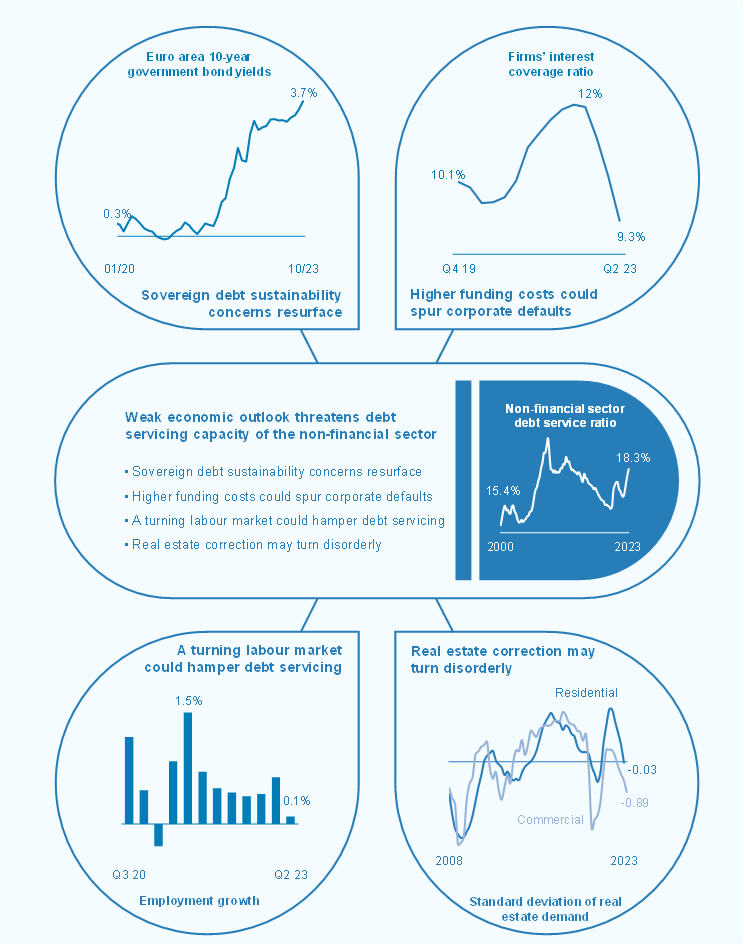
The turbulence seen this last spring, triggered by bank failures outside the euro area, has now abated. While risks to financial stability may appear less acute, they remain elevated. Attention has shifted towards the impact of tight financial and credit conditions and weak economic prospects on the debt servicing capacity of borrowers, the ongoing correction in real estate markets and the resulting risks for banks and non-bank financial intermediaries.
While tight financing conditions help align aggregate demand with supply and ensure that inflation returns to target, they can also push over-extended borrowers into financial distress. Steep increases in interest rates are particularly challenging for borrowers carrying high levels of debt contracted at variable rates or loans that fall due for refinancing in the near term. Disposable incomes, corporate revenues and fiscal positions may suffer an additional squeeze if economic activity disappoints further or if energy prices surge over the coming winter.
Despite such risks, financial markets have remained resilient. This strength reflects expectations of a soft landing, with limited impacts on economic growth as inflation recedes to moderate levels. Sentiment could shift quickly if actual outturns were to deviate from this benign scenario, and disorderly adjustments could be amplified by non-bank financial institutions with elevated credit and liquidity risks. An escalation of the conflict in the Middle East could trigger a sharp increase in risk aversion in financial markets, unravelling the prevailing vulnerabilities. In addition to the potential adverse repercussions for the supply of energy commodities, an escalation could undermine general confidence and slow down economic growth, while pushing inflation rates up in parallel.
Although their lending margins have until now largely benefited from rising interest rates, banks are beginning to face increasing headwinds. Demand for loans is cooling exceptionally quickly and loan losses are starting to rise, albeit from low levels. The ongoing correction in real estate markets – both commercial and residential – may compound these dynamics.
This issue of the Financial Stability Review (FSR) includes two special features. The first examines different strategies employed by euro area banks to manage interest rate risk and the associated implications for bank profitability. The second looks at risks to euro area real estate markets in a turning property market cycle.
The FSR has been prepared with the involvement of the ESCB Financial Stability Committee, which assists the decision-making bodies of the ECB in the fulfilment of their tasks. The FSR promotes awareness of systemic risks among policymakers, the financial industry and the public at large, with the ultimate goal of promoting financial stability.
Luis de Guindos
Vice-President of the European Central Bank
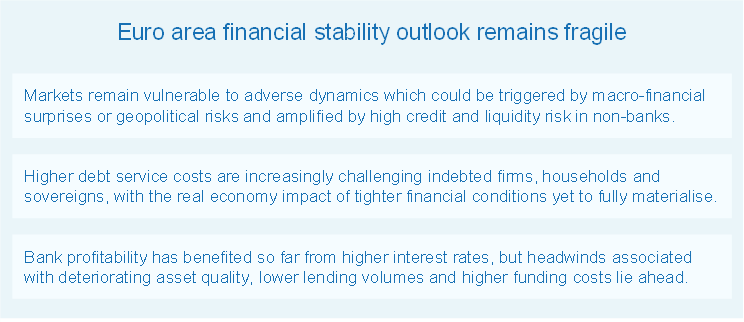
Euro area financial stability outlook remains fragile
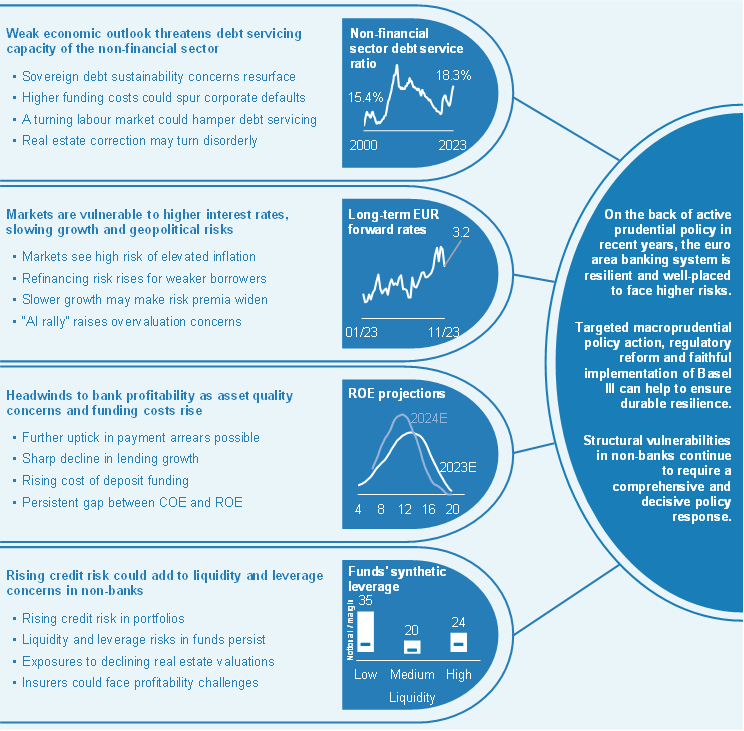
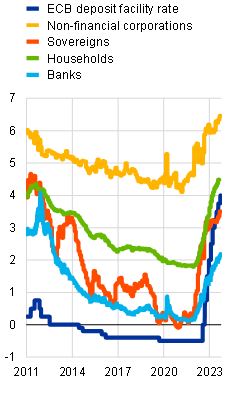
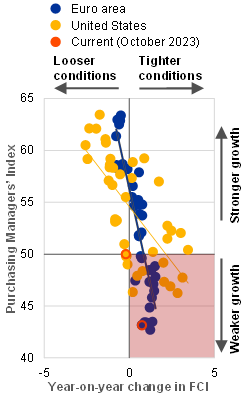
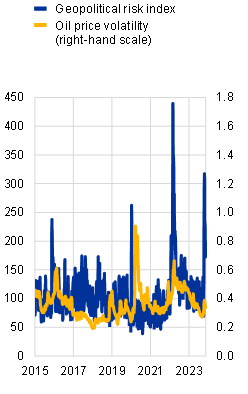
Financial stability risks associated with higher interest rates are emerging in the context of a challenging macro-financial outlook and geopolitical tensions. Financial markets quickly shook off the shock triggered by the bank failures in the United States and Switzerland in March this year and the related expectations of an earlier end to the monetary tightening cycle. Since then, financial stability concerns have pivoted towards the implications of upside risks to inflation and downside risks to growth. Rising ECB policy rates have translated into rising funding costs for all sectors of the economy (Chart 1, panel a). The associated tighter financial and credit conditions are being transmitted to economic activity (Chart 1, panel b). This holds particularly true for the euro area where – unlike the United States – economic outcomes have surprised on the downside since the summer. However, as duration lengthened in the financial system and the real economy during the low interest rate era, a major part of the impact of monetary tightening is yet to materialise, which will pose future challenges for financial and non-financial sectors alike. These concerns are amplified by the recent flare-up of geopolitical tensions in the Middle East. They add to the uncertainty surrounding the macro-financial outlook (Chart 1, panel c), not only because of possible adverse repercussions for energy commodities supply, should the conflict escalate further, but also given their potential to spark risk aversion in financial markets and undermine confidence in the real economy.
Chart 1
Euro area financial stability outlook remains fragile as tighter financing conditions are increasingly propagating to the real economy and geopolitical tensions intensify
|
a) Composite funding costs, by economic sector |
b) Financial conditions index and manufacturing PMIs |
c) Geopolitical risk index and oil price volatility |
|---|---|---|
|
(Jan. 2011-Sep. 2023, percentages) |
(July 2020-Oct. 2023; diffusion index, percentages) |
(1 Jan. 2015-14 Nov. 2023; index, percentages, 7-day moving averages) |
 |
 |
 |
Sources: Caldara and Iacoviello*, Bloomberg Finance L.P., S&P Global Market Intelligence, ECB (MIR, PDF) and ECB calculations.
Note: Panel a: Non-financial corporations: weighted average of the costs of bank borrowing, market-based debt and equity, based on the respective amounts outstanding. Sovereigns: ten-year government benchmark bond yield. Households: lending rates for new loans for house purchase, consumer credit and other household loans weighted by their respective outstanding credit amounts. Banks: volume weighted average of the cost for banks of collecting deposits and the cost for banks of issuing bonds, weighted by the respective outstanding amounts. . Panel b: Goldman Sachs’ financial conditions index (FCI) is a weighted average of risk-free interest rates, exchange rates, equity valuations and credit spreads, with weights corresponding to the direct impact of each variable on GDP.
*) Caldara, D. and Iacoviello, M., “Measuring Geopolitical Risk”, American Economic Review, Vol. 112, No 4, April 2022, pp. 1194-1225.
Against this backdrop, three key themes shape the outlook for euro area financial stability. First, markets and non-banks remain highly vulnerable to adverse macro-financial and geopolitical surprises and associated shifts in market sentiment. Second, tighter financial and credit conditions are increasingly translating into higher debt service costs, weakening the resilience of firms, households and sovereigns. Third, growing vulnerabilities in the real economy can be expected to gradually impair banks’ asset quality, and this, together with lower lending volumes and rising funding costs, may challenge their profitability outlook.
Financial markets and non-banks are vulnerable to adverse macro-financial surprises
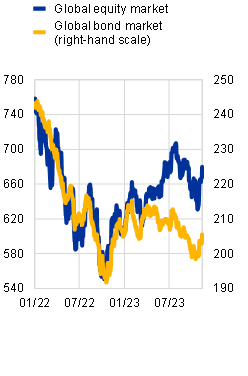
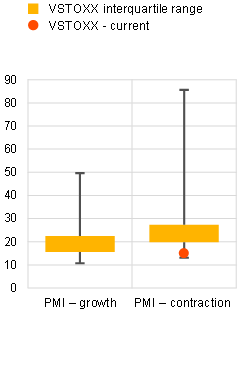
The pricing in financial markets appears to be predicated on optimistic expectations regarding the future macro-financial outlook and hence remains vulnerable to negative surprises. Up until August, expectations that the monetary tightening cycle was nearing its end, with a soft-landing scenario for economic growth and inflation, served to lower market volatility and support investor sentiment (Section 2.1). Global equity markets performed particularly strongly after the turmoil triggered by stresses in the US and Swiss banking sectors in March (Chart 2, panel a) – albeit driven to a large extent by a US tech industry that has benefited from enthusiasm regarding the opportunities offered by artificial intelligence (Section 2.3). In the euro area equity market, volatility has been out of sync with the current weak phase of the economic cycle (Chart 2, panel b). At the same time, corporate credit spreads have remained relatively compressed, while liquidity conditions in sovereign and corporate bond markets have improved. In September, the transition of financial markets towards expectations of higher-for-longer rates gained momentum and was accompanied by rising term premia. This led to a rapid increase in long-term government bond yields and higher equity market volatility, which started to weigh on riskier asset valuations as well. However, the market correction proved to be short-lived, as investor confidence benefited again from a downside surprise in inflation.
Risk sentiment in the markets remains fragile and highly sensitive to further surprises regarding the outlook for inflation, growth and, by extension, the path of monetary policy. If inflation were to prove more persistent than currently anticipated, this could lead to a further increase in long-term interest rates. Coupled with weaker than anticipated economic growth, this, in turn, could trigger a rise in market volatility and risk premia, increasing the likelihood of credit events materialising. Adverse market dynamics could be triggered by unexpected geopolitical shocks and amplified by vulnerabilities associated with the increased digitalisation of financial services (Box 3), heightened leverage in equity option markets (Box 2) and possible forced asset sales by non-bank financial institutions.
Chart 2
Investor optimism leaves markets vulnerable to disorderly repricing, especially if volatility jumps and funds with low liquidity buffers are forced to sell assets
|
a) Global equity and bond market prices |
b) Distribution of VSTOXX, by PMI signal |
c) Distribution of funds’ HQLA stock and historically high outflows |
|---|---|---|
|
(1 Jan. 2022-14 Nov. 2023, indices) |
(2 Jan. 2012-14 Nov. 2023, index) |
(Q2 2023 (HQLA), Jan. 2007-June 2023 (outflows), percentages of total net assets) |
 |
 |
 |
Sources: Bloomberg Finance L.P., S&P Global Market Intelligence, LSEG Lipper IM, ECB (CSDB) and ECB calculations.
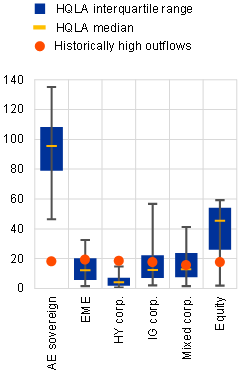
Notes: Panel a: global equity markets are reflected by the MSCI All Country World Index and global bond markets by the Bloomberg Barclays Multiverse Index. Panel b: based on Composite PMI with readings above 50 indicating growth. The whiskers correspond to the minimum and maximum values observed. Panel c: the box plots show the distribution of fund-level stocks of high-quality liquidity assets (HQLA), calculated according to the Basel Liquidity Coverage Ratio Requirements for HQLA. Whiskers refer to the 5th and 95th percentiles of the distribution respectively. HQLA Level 1 assets include cash, cash equivalents and qualifying government bonds, while Level 2A and Level 2B assets include less liquid assets such as qualifying covered bonds, corporate bonds, asset-backed securities and equities. The stock of HQLA is calculated by applying a haircut of 0% to cash and Level 1 assets, 15% to Level 2A assets and 40% to Level 2B assets. The red dots show the worst outflows for each fund category – calibrated in line with ESMA’s stress simulation for investment funds* – as the 5% expected shortfall, which averages monthly fund-level net flows experienced between January 2007 and June 2023 by a sample of bond and equity funds below the 5th percentile of the distribution. AE stands for advanced economies; EME stands for emerging market economies; HY stands for high yield; IG stands for investment grade.
*) See ESMA, “Stress simulation for investment funds”, ESMA Investment Report, 2019.
Non-banks continue to face high credit risks, despite some rebalancing of their investment portfolios towards safer assets. As of mid-2023 cumulative purchases of investment-grade sovereign and corporate debt by the non-bank financial intermediation (NBFI) sector over one year have been close to the record highs observed during the post-pandemic recovery (Section 4.1). Shifts by investors towards safer fund types helped mitigate aggregate credit risk in the sector thanks to reduced incentives to search for yield. That said, high economic uncertainty and tighter financial conditions have contributed to a deteriorating credit outlook for several issuers, exposing the NBFI sector to possible revaluation losses stemming from downgrades and an increase in default risk. In particular, some non-banks remain heavily exposed to interest rate-sensitive sectors, such as highly indebted corporates and real estate. Deteriorating corporate fundamentals and the ongoing correction in real estate markets could expose non-banks investing in these sectors to revaluation losses and investor outflows.
Low liquid asset holdings could expose investment funds to the potential risk of forced asset sales if macro-financial outcomes deteriorate. Overall liquidity buffers remain relatively low across the investment fund sector (Section 4.2), although aggregate figures mask large differences across and within fund types. This suggests that there is a more vulnerable cohort of funds with inadequate liquidity buffers to meet a redemption shock equivalent in size to the worst recorded outflows (Chart 2, panel c). As such, the risk remains high that, in the event of sudden liquidity needs, some funds could amplify adverse market dynamics by exhibiting procyclical selling behaviour. Granular fund-level data on open-ended bond funds suggest that their liquidity resilience to severe redemptions has deteriorated compared with levels observed before the pandemic (Box 6). This could introduce risks to wider financial stability, especially when low liquidity buffers coincide with relatively high leverage (Section 4.2). All in all, this highlights the importance of strengthening the resilience of the NBFI sector from a macroprudential perspective (Chapter 5).
Tighter financial conditions are testing the resilience of euro area firms, households and sovereigns
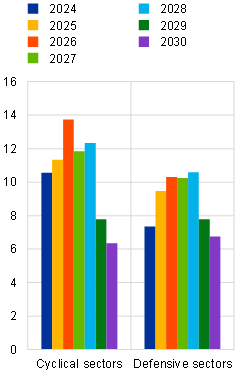
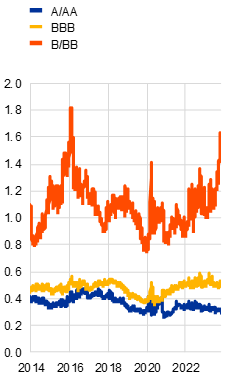
Euro area corporate profitability has held up well, but higher interest rates are weighing on the debt servicing capacity of more vulnerable firms. High profit margins have continued to underpin corporate profitability, but activity has been slowing in several sectors (Section 1.3). Tighter financing conditions, in terms of both the cost and the availability of credit, coupled with the uncertain business outlook, have led to a material drop in firms’ external financing (Chart 3, panel a). As the stock of loans continues to reprice, higher debt service costs could challenge cyclical sectors more than defensive sectors. The redemption profiles show that cyclical sectors are generally more exposed to refinancing risk, as a larger share of their bonds matures in the short term (Chart 3, panel b). Rollover risk might be further accentuated if the economy were to weaken at the same time. Weaker macro-financial conditions have already started to translate into higher corporate insolvencies: in aggregate, these have now surpassed pre-pandemic levels, albeit unevenly across sectors. While this partly reflects the unwinding of the insolvency backlog that accumulated during the pandemic, defaults are likely to rise even more if yields continue increasing or if energy prices start soaring again, for example. This is already reflected in rising expected default frequencies, in particular for the more vulnerable high-yield segment (Chart 3, panel c). Looking ahead, a sharper economic slowdown than currently anticipated could prove challenging for euro area firms, especially if they have high debt levels, subdued earnings and low interest coverage ratios.
Chart 3
Tighter financial conditions are increasingly challenging the debt servicing capacity of firms, given high short-term debt servicing needs and rising corporate insolvencies
|
a) Financing flows of non-financial corporations, by funding instrument |
b) Maturity wall for euro area non-financial firms, by type of industry |
c) Corporate EDFs in the euro area, by rating category |
|---|---|---|
|
(Q1 2020-Q3 2023, € billions) |
(2024-30, percentages) |
(1 Jan. 2014-14 Nov. 2023, percentages) |
 |
 |
 |
Sources: Bloomberg Finance L.P., Moody’s Analytics, Intercontinental Exchange, ECB (BSI, CSEC) and ECB calculations.
Notes: Panel b: figures include corporate bonds that are not in default and are issued by euro area entities. Cyclical sectors include consumer discretionary, technologies, energy, materials, industrials and communications. Defensive sectors include consumer staples, health care and utilities. Panel c: EDFs stands for the expected default frequencies of non-financial corporations.
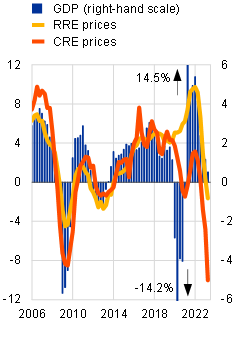
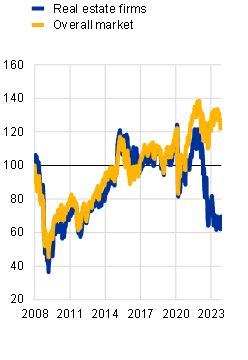
Real estate firms are particularly vulnerable to losses in the light of the ongoing downturn in euro area commercial real estate markets. In an environment of tighter financing conditions and elevated macro-financial uncertainty, commercial real estate (CRE) prices have continued to decline (Chart 4, panel a), with subdued market activity hampering price discovery. The effects of higher interest rates have been compounded by structurally lower demand for some CRE assets following the pandemic. In fact, demand for office space deteriorated sharply in the second quarter of 2023, particularly in the non-prime segment where concerns about the environmental footprint of buildings play a more important role. This mix of cyclical and structural challenges has resulted in real estate firms suffering significant rating downgrades in recent months (Section 1.5). Conditions have been particularly challenging for property developers faced with falling sales prices, contracting order books and rising input costs. As such, the stock prices of real estate firms have continued to underperform the overall market by a large margin (Chart 4, panel b). From a systemic risk perspective, adverse CRE market outcomes on their own are unlikely to cause losses that would take the euro area banking sector below minimum capital requirements, but a significant deterioration in CRE asset quality could pose challenges for some banks that are more heavily exposed to CRE loans (Special Feature B).
Euro area households, especially those with lower incomes and in countries with mainly floating-rate lending, are increasingly being challenged by higher interest rates. Resilient labour markets as well as government support measures and excess savings accumulated during the pandemic have so far mitigated euro area household vulnerabilities. However, real household incomes and consumption remain under pressure, especially in the lower income segments. At the same time, higher interest rates have begun to feed through to higher debt service costs, notably in countries where the share of variable-rate lending has historically been very high (Section 1.4). Going forward, households may see their debt servicing capacity erode if energy prices soar again, interest rates remain higher for longer and/or labour market conditions deteriorate significantly.
Chart 4
Residential and commercial real estate markets have continued their simultaneous downturn, as higher funding costs weigh on affordability
|
a) Euro area real GDP growth, and RRE and CRE prices |
b) Stock prices of real estate firms versus the overall market |
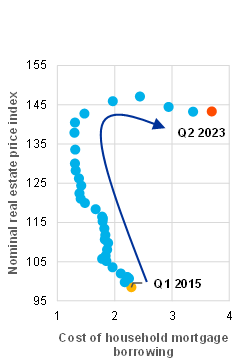
c) Real estate price index and cost of household mortgage borrowing in the euro area |
|---|---|---|
|
(Q1 2006-Q2 2023, annual percentage changes) |
(4 Jan. 2008-10 Nov. 2023, indices: |
(Q1 2015-Q2 2023, percentages, index) |
 |
 |
 |
Sources: Bloomberg Finance L.P., Eurostat and ECB (MNA), ECB (MIR, RESC) and ECB calculations.
Note: Panel b: real estate firms are represented by the STOXX Europe 600 Real Estate Price and the overall market by the STOXX Europe 600.
The ongoing correction in residential real estate (RRE) markets may compound pre-existing vulnerabilities of euro area households. Euro area RRE markets continued to cool in the first half of 2023 (Chart 4, panel a), with prices already starting to fall in a number of countries. The steep increase in borrowing costs, coupled with deteriorating consumer confidence and housing market prospects, has had a negative impact on the demand for mortgages. This, together with a substantial tightening of credit standards by banks, led to a sharp drop in new lending (Section 1.5). On the supply side, challenging housing market conditions are reflected in weak construction confidence and a sharp drop in the issuance of new residential building permits. Despite declining prices in some euro area countries, valuations still seem stretched, suggesting that further falls are possible. In particular, RRE markets could come under severe stress should a material weakening of the labour market add to the affordability challenges arising from tighter conditions in mortgage markets (Chart 4, panel c, Special Feature B).
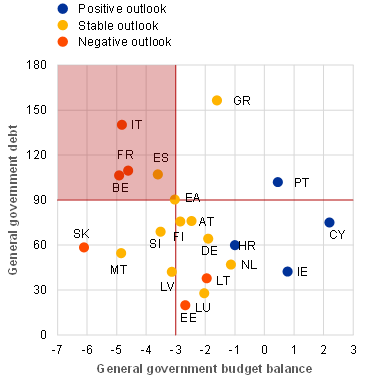
Medium-term sovereign vulnerabilities are rising, particularly for jurisdictions where debt levels are already high. With maturing public debt being rolled over at higher interest rates, sovereign interest payments have started to rise, mainly in countries where short-term refinancing needs are higher. Sovereign issuance activity in primary markets has remained brisk this year (Chart 5, panel a). Increased issuance by euro area sovereigns has been smoothly absorbed by the market despite reduced Eurosystem asset purchases as a result of quantitative tightening. Demand might have been supported by the higher yields offered by sovereign bonds (Box 1). Nevertheless, fiscal fundamentals remain fragile in a number of countries in the light of weaker economic growth prospects, given elevated debt levels and continued high budget deficits (Chart 5, panel b). So far, spreads in the government bond market have remained contained, as many sovereigns managed to secure cheap financing at longer maturities during the period of low interest rates. However, risks of fiscal slippage could reignite sovereign debt sustainability concerns and compel market participants to reassess sovereign risk. Any unwarranted, disorderly sovereign debt market dynamics that may pose a serious threat to the transmission of monetary policy across the euro area can be countered by the ECB’s Transmission Protection Instrument if the necessary conditions are fulfilled.
Chart 5
Short-term sovereign stress has remained contained so far, but higher funding costs and less prudent fiscal policies could reignite sovereign debt sustainability concerns
|
a) Net issuance of government debt securities in the euro area |
b) General government debt, budget balance and rating outlooks across the euro area |
|---|---|
|
(Jan. 2019-Sep. 2023, € billions) |
(average values over 2023-24, percentages of GDP) |
 |
|
Sources: ECB (GFS), Moody’s Analytics, Fitch Ratings, S&P Global Market Intelligence, European Commission (AMECO) and ECB calculations.
Notes: Panel b: rating outlook refers to the average from Moody’s Analytics, Standard & Poor’s and Fitch and represents the outlook as at 14 November 2023. The vertical red line represents the Maastricht government deficit criterion of 3% of GDP. The horizontal red line represents the threshold of 90% of GDP for sovereign debt and is based on findings in the empirical literature. See, for example, Checherita, C. and Rother, P., “The impact of high and growing government debt on economic growth – an empirical investigation for the euro area”, Working Paper Series, No 1237, ECB, 2010.
Higher rates underpin bank profitability, but worsening asset quality and higher funding costs pose headwinds
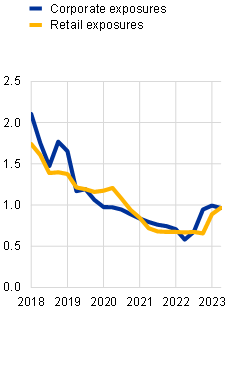
Euro area banks’ profitability has continued to improve on the back of rising interest rates, but uncertainties around the earnings outlook have increased. Boosted mainly by wider interest margins, euro area banks continued to enjoy robust earnings growth in the first half of 2023. They posted the highest profitability levels witnessed in more than a decade, with an almost double-digit return on equity (Chart 6, panel a). The strengthening of profitability was particularly notable for banks in countries where variable-rate lending predominates and where the pass-through of higher policy rates to deposit costs has been slower (Chapter 3). Going forward, though, banks will increasingly feel the downside impact of higher interest rates, as tighter financing conditions and a higher cost of living adversely affect borrowers’ debt servicing capacity. While banks’ non-performing loan ratios remained broadly unchanged at a low level of just above 2% in the first half of 2023, there have been some nascent signs of rising losses on some loan portfolios that are more sensitive to cyclical downturns. In fact, default rates on both corporate and retail exposures have already started picking up (Chart 6, panel b), heralding further increases in non-performing loans. As such, banks may face the risk of higher provisioning costs as risks in the non-financial sectors materialise in the context of weaker than anticipated economic conditions, potentially higher-for-longer interest rates or possible disorderly developments in real estate markets.
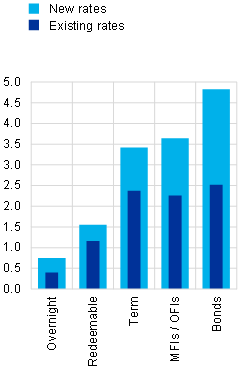
In addition, lower lending volumes and higher bank funding costs may weigh on euro area bank earnings going forward. Lending dynamics have slowed markedly as a result of tighter lending standards and weak credit demand, with year-to-date lending flows to households and firms reaching their lowest levels since 2015. Uncertain macro-financial conditions may continue to weigh on volume growth going forward, partly offsetting the positive margin effect of higher interest rates on banks’ net interest income. After the stress in the US and Swiss banking markets in the spring of this year, bank bond spreads stabilised at levels above historical averages. At the same time, the gradual shift from overnight to term deposits continued, with some signs of increased deposit competition among banks, but the pace of deposit repricing remains limited compared with previous hiking cycles. Looking ahead, bank funding costs are set to rise further as maturing liabilities reprice at higher levels (Chart 6, panel c), targeted longer-term refinancing operation (TLTRO) funds are gradually repaid and the composition of funding moves back towards long-run averages with a higher share of term deposits and bonds (Chapter 3). In terms of the management of interest rate risk, euro area banks have made increasing use of the interest rate swaps market since 2021, especially for longer maturities (Special Feature A).
The resilience of the euro area banking sector is, in aggregate, underpinned by strong capital and liquidity positions. Euro area banks proved resilient to the bouts of stress in the US and Swiss banking markets earlier this year, building on solid bank fundamentals. Standard regulatory metrics point towards strong liquidity resilience overall, despite a recent decline in banks’ liquidity coverage ratios following TLTRO repayments. At the same time, with payout ratios increasing only slightly, capital ratios have risen in line with higher retained earnings. The euro area banking sector’s resilience to adverse shocks was also confirmed by the results of the European Banking Authority’s 2023 EU-wide stress test. To preserve resilience from a more structural perspective, euro area banks need to carefully manage the implications of climate change and should also address the risks posed by the digitalisation of the financial industry. Such risks include the accelerated pace of bank runs (Box 3), the growing threat from cyber risks and the challenges associated with the introduction of digital currencies (Box 4).
Chart 6
Rising rates helped bank profitability improve, but the prospect of deteriorating asset quality and higher funding costs increases downside risks to bank earnings
|
a) Euro area banks’ return on equity, cost of equity and price-to-book ratios |
b) Default rates on banks’ corporate and retail exposures |
c) New and existing rates on bank deposits and bonds |
|---|---|---|
|
(Q1 2015-Q2 2023, percentages, ratios) |
(Q1 2018-Q2 2023, percentages) |
(Sep. 2023, percentages) |
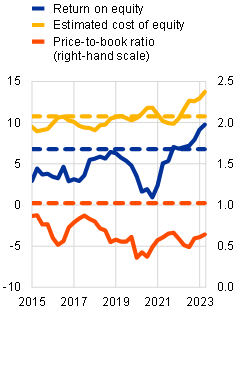 |
 |
 |
Sources: Bloomberg Finance L.P., Dealogic, ECB (supervisory data, MIR) and ECB calculations.
Notes: Panel a: the dashed horizontal lines represent the long-term averages, i.e. Q4 2000-Q2 2023, for banks’ return on equity, cost of equity and price-to-book ratio. Banks’ estimated cost of equity is calculated following the methodology set out by Altavilla et al.* Panel b: annualised quarterly default rates (two-quarter moving averages). Panel c: for all funding sources except bonds, existing rates indicate the average annual rate paid over the last 12 months and the latest monthly observation so as to account for the timing of the recognition of higher expenses in profit and loss. For bonds, “New rates” refers to the weighted average yield at issuance on new issuances within the latest month and “Existing rates” to the weighted average yield at issuance for all outstanding bonds. MFIs/OFIs stands for monetary financial institutions/other financial institutions.
*) Altavilla, C., Bochmann, P., De Ryck, J., Dumitru, A., Grodzicki, M., Kick, H., Melo Fernandes, C., Mosthaf, J., O’Donnell, C. and Palligkinis, S., “Measuring the cost of equity of euro area banks”, Occasional Paper Series, No 254, ECB, 2021.
Despite greatly improved profitability and continued resilience across the sector, bank valuations have remained compressed. Among other things, this may be explained by the lingering structural problems across the industry (such as low cost-efficiency) and the high risk premia embedded in banks’ cost of equity (Box 5). Low valuations may also reflect concerns about the sustainability of bank profits, given one-off factors such as the imposition of bank levies – or discussions in that direction – in a number of countries, as well as the headwinds associated with the prospect of worsening asset quality and higher funding costs going forward.
Macroprudential policies should help safeguard and strengthen resilience across the financial system
Safeguarding banking sector resilience remains key to navigating the turn of the financial cycle. Euro area macroprudential authorities have increased capital buffer requirements further in recent months, thereby bolstering banks’ resilience. These actions have also strengthened the macroprudential policy space by expanding potentially releasable capital buffers. Macroprudential authorities should preserve these buffers to ensure that they remain available in case conditions in the banking sector deteriorate. They should also ensure that borrower-based measures remain in place as structural backstops to prevent lending standards deteriorating and to protect borrower quality. Beyond highlighting the importance of resilient banking systems, the lessons learnt from the stress in the US and Swiss banking markets in the spring of this year reaffirm the need to implement outstanding Basel III reforms and complete the banking union. Against this backdrop, recent initiatives to impose taxes on banks may have negative repercussions for financial stability, as they make it harder for banks to accumulate capital.
Structural vulnerabilities in different parts of the non-bank financial sector require a comprehensive policy response to increase resilience. Parts of the non-bank financial sector remain sensitive to adverse developments in macro-financial conditions that could place downward pressure on asset valuations, particularly in the case of riskier assets. Structural vulnerabilities arising from liquidity mismatches and leverage could amplify market-wide price corrections and aggravate liquidity stresses in the financial system. The large market footprint and interconnectedness of non-bank financial institutions make it all the more important to increase the sector’s resilience by developing a comprehensive set of policy measures across non-bank entities and activities, taking a macroprudential perspective. This includes enhancing the liquidity preparedness of non-bank market participants to meet margin and collateral calls, tackling risks from non-bank leverage and mitigating liquidity mismatch in open-ended funds. International policy coordination will be key in this context to promote a level playing field and minimise the risk of cross-border arbitrage.
1.1 A recession remains a possible scenario as an already weak economic outlook deteriorates
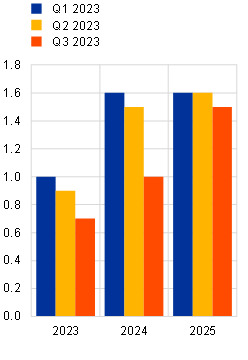
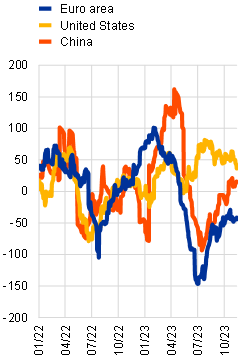
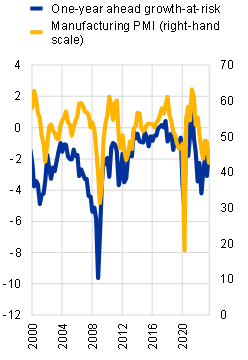
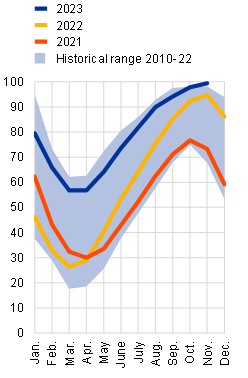
Several downward revisions to forecasts and negative economic surprises confirm a weak economic outlook with substantial downside risks. The ECB/Eurosystem staff macroeconomic projections as well as other official and private sector forecasts were revised downwards for several quarters in a row, reflecting a worsened global economic environment, tighter financial conditions, lower aggregate demand and lower credit supply. Weak foreign demand and receding fiscal support are weighing on activity, too. As of the third quarter of 2023, GDP growth is expected to come in at 0.7% in 2023 and 1.0% in 2024, the latter being a reduction of 60 basis points compared with six months earlier (Chart 1.1, panel a). While economic surprises have been to the upside in the United States in 2023, the news has been predominantly more negative than expected for the euro area and China (Chart 1.1, panel b). Even though forecasts indicate that the euro area economy might enjoy a soft landing, a recession also remains a likely scenario (see also Chapter 2). This risk is captured by the manufacturing Purchasing Managers’ Index (PMI) – historically a reliable predictor of GDP growth – being in clearly contractionary territory (below 50 index points) as of the third quarter of 2023 (Chart 1.1, panel c). In addition, the one-year ahead GDP growth-at-risk estimate indicates that, with a probability of 5%, economic growth within the next 12 months may turn out lower than -1.6%, which would mean a more severe contraction. This suggests that there are downward risks to overall economic activity in the euro area, albeit varying from country to country.
Chart 1.1
Several rounds of downward revisions to forecasts confirm a weak economic outlook
|
a) ECB forecasts for annual euro area GDP growth |
b) Citi Economic Surprise Index |
c) GDP growth-at-risk and euro area manufacturing PMI |
|---|---|---|
|
(2023-25, percentages) |
(3 Jan. 2022-14 Nov. 2023, index) |
(Q1 2000-Q3 2023, left-hand scale: percentages, right-hand scale: index) |
 |
 |
 |
Sources: ECB/Eurosystem staff macroeconomic projections, Bloomberg Finance L.P., Citigroup, S&P Global Market Intelligence, ECB and ECB calculations.
Notes: Panel a: includes GDP growth for Q1 and Q2 2023 as already reported at the time of publication. The respective forecasts are for the entirety of 2023 as per the respective ECB/Eurosystem staff macroeconomic projection rounds of Q1 through Q3 2023. Panel b: Citi Economic Surprise Index values above zero represent positive economic surprises in sum, while values below zero represent negative economic surprises. Panel c: growth-at-risk is the 5th percentile prediction of a quantile regression model estimated on a panel of euro area countries. Explanatory variables include GDP growth and indicators of cyclical systemic risk, financial stress, the debt service ratio and economic sentiment. See Lang, J.H., Rusnák, M. and Greiwe, M., “Medium-term growth-at-risk in the euro area”, Working Paper Series, No 2808, ECB, 2023.
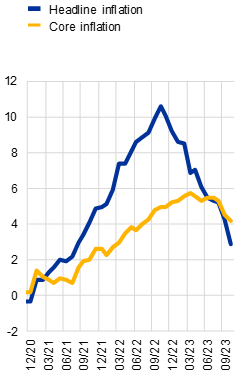
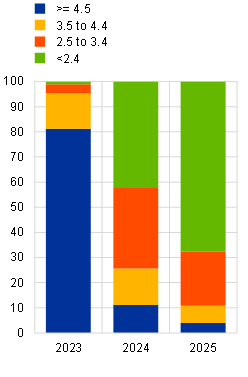
The risk of higher energy prices interrupting the ongoing decline of headline inflation cannot be ruled out. Headline inflation in the euro area declined notably from over 10% year on year in October 2022 to 2.9% in October 2023. The dispersion of inflation across countries also narrowed markedly. However, core inflation remains persistently high and only started to decline in September 2023 (Chart 1.2, panel a). The majority of professional forecasters see annual headline inflation declining to below 3.4% in 2024 and below 2.4% in 2025 (Chart 1.2, panel b).[1] Whether rising energy prices, especially for liquified natural gas, will affect inflation over the winter will largely depend on weather conditions, as well as on global economic and political developments. An interruption of liquified natural gas supplies from Russia or higher than expected demand from China could result in substantially higher prices, as energy price volatility remains elevated (Chapter 2). That said, the EU is entering the colder season well prepared, with natural gas storage facilities almost full (Chart 1.2, panel c). A continuation of the recent rise in oil prices or more notable increases due to a possible further escalation of the conflict in the Middle East may add to inflationary pressures as well as to downside risks to economic growth (Overview).
Euro area growth prospects may be adversely affected by a further slowdown of the Chinese economy and geopolitical tensions. The ongoing crisis in the Chinese real estate sector is weighing on economic activity in China, resulting in lower demand for European export goods, with a negative knock-on effect on euro area growth. Even though direct euro area bank exposures to the Chinese real estate sector are limited, other transmission channels may allow for spillovers, should the situation deteriorate further (Chapter 2). Generally, there might be a further aggravation of geopolitical risk from the conflict in the Middle East, the presidential elections in the United States in 2024, Russia’s continuing unjustified war against Ukraine and ongoing tensions between the United States and China. On the back of a weak economy and stubbornly high core inflation, turbulence in financial markets due to geopolitical tensions could easily exacerbate downward risks for economic growth and financial stability in the euro area. Currently, a further escalation of the conflict in the Middle East could induce instability through higher energy prices, with serious implications for inflation and potentially for monetary policy. Additionally, an escalation may also depress consumer sentiment and investor risk appetite, adversely impacting growth prospects in the euro area.
1.2 Sovereign vulnerabilities remain elevated due to higher refinancing costs and a weak macro-financial outlook
Stress in sovereign bond markets has generally receded, but risks remain elevated. Since the publication of the previous Financial Stability Review in May 2023, stress levels in sovereign bond markets have declined. Nevertheless, the dispersion across countries started to rise again at the end of September (Chart 1.3, panel a). As there are considerable differences across euro area countries and downside risks to fiscal positions, stress could increase again, especially if market participants perceive budget planning in some countries to be detrimental to longer-term debt sustainability. Overall, the euro area budget deficit is projected to decline over the coming years, accompanied by a tightening of the fiscal stance.[2] Such a tightening would help to ensure that fiscal policies are better aligned with the monetary policy response to inflation. While the expected phasing-out of government support measures introduced in response to the energy price shock and high inflation could help to achieve a tightening of the fiscal stance, governments might counteract this effect by introducing new stimulus measures in response to a stronger deterioration in economic activity, for example, or a renewed increase in energy prices. In addition, there are risks of delays in the implementation of the Next Generation EU programme, which may weigh on national sovereign budgets going forward, while heightened geopolitical tensions could require increases in defence spending.
The ongoing negotiations on reforming EU fiscal rules are inducing significant uncertainty. As the general escape clause contained in the EU’s Stability and Growth Pact will be deactivated by the end of 2023, reaching agreement is critical in order to anchor expectations for debt sustainability and sustainable, inclusive growth. Failure to swiftly agree on and put in place a credible, transparent and predictable fiscal framework could create uncertainty and unduly delay necessary fiscal adjustment and the impetus for reforms and investment.[3] Such uncertainty would likely lead to further increases in government bond yields and spreads (Chart 1.3, panel b), especially for countries that may then fail to comply with the Stability and Growth Pact and face excessive deficit procedures.
Chart 1.3
Stress in sovereign bond markets has receded, but uncertainty remains high
|
a) Euro area sovereign composite indicator of systemic stress |
b) Ten-year government bond yields by rating group |
|---|---|
|
(1 Jan. 2015-14 Nov. 2023, index) |
(1 Jan. 2020-14 Nov. 2023; left-hand scale: percentages, right-hand scale: basis points) |
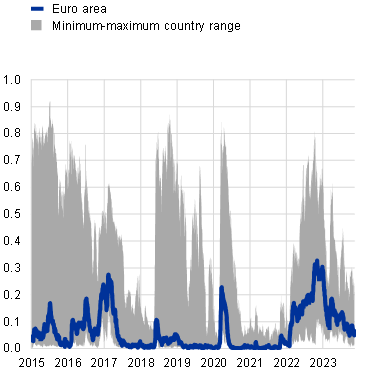 |
 |
Sources: ECB, Bloomberg Finance L.P., LSEG, S&P Global Market Intelligence, Moody’s Analytics, Fitch Ratings and ECB calculations.
Notes: Panel a: the sovereign composite indicator of systemic stress is unit-free and lies within the interval (0, 1). The indicator is available for 11 euro area countries: Belgium, Germany, Ireland, Greece, Spain, France, Italy, the Netherlands, Austria, Portugal and Finland. See Garcia-de-Andoain, C. and Kremer, M., “Beyond spreads: measuring sovereign market stress in the euro area’’, Economics Letters, Vol. 159, 2017, pp. 153-156. Panel b: government bond yields are weighted by annual GDP as at 2022. Ratings refer to the average from Moody’s, Standard & Poor’s and Fitch and represents the ratings as at 14 November 2023.
The euro area sovereign debt-to-GDP ratio declined further but is expected to remain above pre-pandemic levels over the medium term. The euro area government debt-to-GDP ratio has benefited from a favourable interest rate-growth differential (the snowball effect) over recent quarters and is expected to fall to 89% in 2023, significantly below the peak seen during the pandemic. In the light of upward pressure from primary deficits and positive deficit-debt adjustments, as well as a narrowing of the snowball effect, the ratio is projected to stabilise at around 88% over the course of 2024 and 2025, above the pre-pandemic level of 84%.[4] While the situation differs across euro area countries, debt levels generally remain elevated.
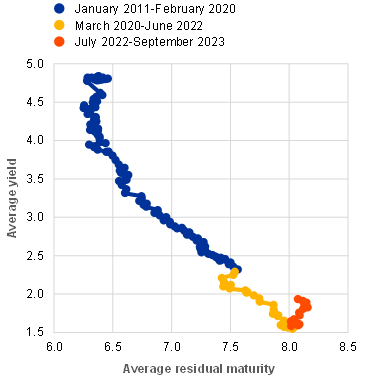
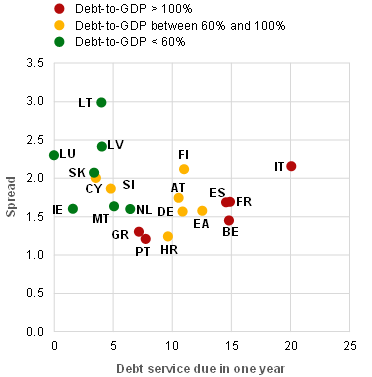
Sovereign debt service is still benefiting from the favourable financing conditions of the past but might face greater challenges in the future. Net debt issuance by euro area governments has been stable throughout 2023 – in line with previous years. With the Eurosystem reducing its footprint in sovereign bond markets, private sector actors like banks, non-bank financial institutions and foreign investors have stepped in to absorb fiscal issuance (Box 1). However, sentiment among such investors could change if fiscal policies in some euro area countries were perceived as detrimental to longer-term debt sustainability. During the pandemic, governments used favourable financing conditions to extend the maturity profile of their outstanding debt, helping to reduce refinancing risks going forward. While the currently higher interest rates feed slowly through to sovereign debt stocks, governments have broadly maintained the same maturity profile (Chart 1.4, panel a). At the same time, yields in sovereign bond markets are around 1.5 percentage points above the average yield on debt portfolios, indicating significant potential for increases in the interest burden as maturing debt is rolled over (Chart 1.4, panel b). Countries with higher short-term refinancing needs are likely to see a faster increase in their interest burden, which may pose challenges going forward.
Chart 1.4
Sovereigns have extended their debt maturity, but higher interest rates will increase their interest burden going forward
|
a) Average yield and residual maturity on the outstanding debt of euro area governments |
b) Spread between current and average yields on outstanding government bonds and gross debt service due in one year |
|---|---|
|
(Jan. 2011-Sep. 2023; years, percentages) |
(Q2 2023, Sep. 2023; percentages of GDP, percentage points) |
 |
 |
Sources: ECB (GFS), LSEG, Bloomberg Finance L.P. and ECB calculations.
Notes: Panel b: the y-axis shows the difference between ten-year government bond yields and the average yield of the outstanding debt portfolio as at September 2023. Data for debt service due in one year refer to September 2023; data for the debt-to-GDP ratio refer to the second quarter of 2023.
Overall, risks to sovereign debt sustainability appear to be manageable in the short run, but medium-term challenges could add to financial stability risks. While debt levels in the euro area have stabilised, medium- and longer-term challenges such as geopolitical risks, climate change and ageing populations are adding to sovereign vulnerabilities. These challenges underline the need for a robust EU framework for economic and fiscal policy coordination and surveillance. The outlook for sovereigns may deteriorate if financial conditions tighten further, which would increase governments’ interest burdens, especially for sovereigns with high refinancing needs. In particular, debt sustainability concerns may arise going forward if governments do not pursue fiscally prudent paths or if highly indebted countries do not sufficiently reduce their debt ratios.
Box 1
Sovereign bond markets and financial stability: examining the risk to absorption capacity
The smooth absorption of sovereign debt issuance by the financial sector is essential for financial stability. Sovereign bonds are widely used as high-quality liquid assets and their prices serve as benchmarks for the pricing of various financial contracts. This means that the capacity of investors to absorb additional issuance is key for the orderly functioning of sovereign bond markets. Market conditions may have been impacted by reduced demand for government bonds as net purchases of sovereign debt by the Eurosystem came to a halt at the end of June 2022.[5] At the same time, the supply of government bonds is expected to remain high. Against this background, this box proposes a framework for assessing the potential challenges to financial stability related to the limits of the absorption capacities of different sectors active in sovereign bond markets.
1.3 Tight financial conditions are starting to weigh on the debt servicing capacity of non-financial corporations
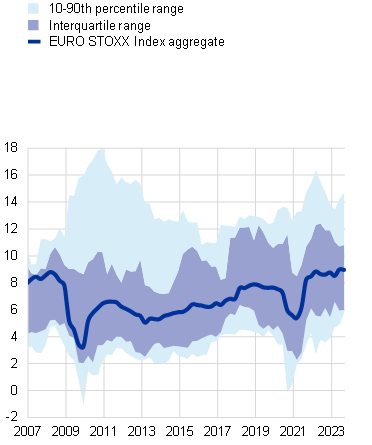
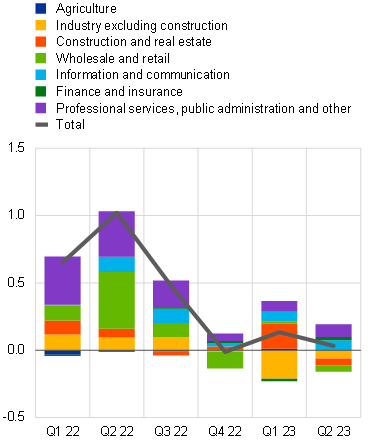
Euro area non-financial corporations (NFCs) entered the hiking cycle with resilient balance sheets, but activity is slowing in several sectors. A long period of ultra-low interest rates and a strong post-pandemic recovery helped the average corporate to build resilience. Euro area firms benefited from strong gross profits throughout the first half of 2023, reflecting continued rises in selling prices. This was also facilitated by firms maintaining their profit margins at stable levels (Chart 1.5, panel a). Growth has come to a halt across most sectors as the effects of the recovery have faded and the impact of tighter financial conditions has increased. So far, service-oriented sectors have not been as badly affected, but some industrial sectors are already contracting (Chart 1.5, panel b). Uncertainty around the future path of this slowdown persists. Downside risks could materialise, especially if inflation remains too high for too long and triggers a further tightening of financial conditions or if an external shock hits. This might take the form of renewed substantial rises in energy prices or supply bottlenecks, possibly driven by geopolitical tensions.
Chart 1.5
Firms maintain profit margins, but growth is slowing
|
a) Profit margins across EURO STOXX sectors |
b) Growth in gross value added |
|---|---|
|
(Q1 2007-Q3 2023, percentages) |
(Q1 2022-Q2 2023, percentages) |
 |
 |
Sources: Bloomberg Finance L.P., Eurostat and ECB calculations.
Notes: Panel a: the ranges in the chart cover the 17 non-financial sectors of the 20 sector indices that comprise the EURO STOXX Index. Panel b: growth in gross value added is shown as quarter-on-quarter changes in calendar-adjusted and seasonally adjusted gross value added.
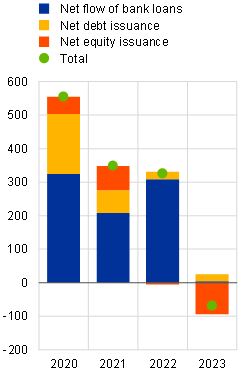
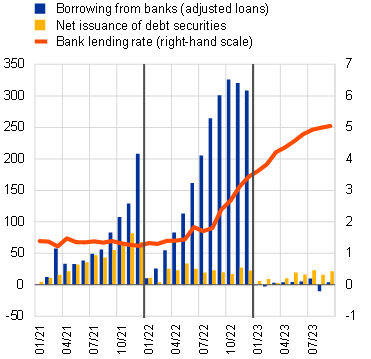
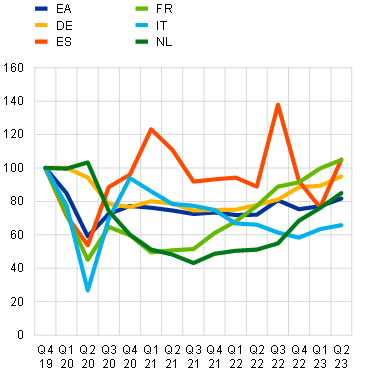
Firms have limited their borrowing in a climate of rising financing costs, causing leverage to decline. The increases in corporates’ financing costs over the past few months reflect the smooth transmission of monetary policy. The resulting tightening of credit standards by banks has been compounded by a drop in firms’ demand for external financing and has led to a material decline in lending volumes. Since the beginning of 2023, net borrowing from banks and net issuance of debt securities has almost come to a halt (Chart 1.6, panel a). The lower demand for credit also mirrors the greater availability of internal sources to fund capital expenditures, such as ample cash buffers and solid retained earnings built up during the post-pandemic recovery. The decline in new borrowing has also allowed the corporate sector to further deleverage, reducing gross debt[6] to 131% of gross value added in the second quarter of 2023, down by 10 percentage points year on year and below pre-pandemic levels.
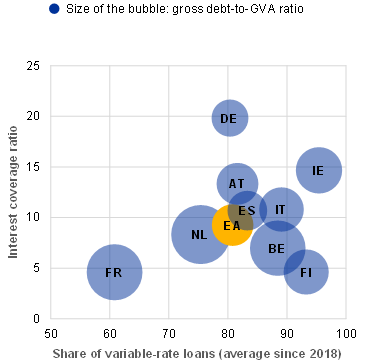
The debt servicing capacity of some firms may become a concern as higher interest rates feed through to corporate debt stocks. Prior to and during the pandemic, firms benefited from low interest rates, which helped to push interest coverage ratios up and default risks down. Because corporates generally have a larger share of adjustable-rate loans, they are affected by interest rate changes more quickly than other economic sectors. While the aggregate interest coverage ratio of euro area firms remained solid at 9.3 in the second quarter of 2023, higher interest expenses have already pushed it down by 2.7 percentage points compared with a year before. Interest expenses are expected to increase further with successive repricing of the loan stock. This may raise concerns over corporates’ debt servicing capacity, especially where debt levels are high and interest coverage ratios are low (Chart 1.6, panel b).
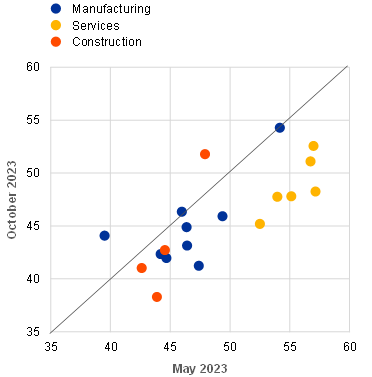
Although generally still low, bankruptcies have started picking up, with some euro area countries seeing pre-pandemic levels surpassed. The more challenging macro-financial conditions, together with vulnerabilities built up over the pandemic, have led to an increase in insolvencies across countries (Chart 1.7, panel a). While this partly reflects the reduction of the insolvency backlog that accumulated during the pandemic, defaults are likely to rise further, with high-frequency indicators suggesting that the economic downturn is becoming more broad-based across countries and sectors (Chart 1.7, panel b). Default risk could particularly affect firms that have not recovered from the strains inflicted by the pandemic and last year’s energy price shock and could increase should energy prices take off again.
Chart 1.7
Bankruptcies are increasing as the outlook for economic growth deteriorates
|
a) Corporate bankruptcies |
b) PMIs across sectors and countries |
|---|---|
|
(Q4 2019-Q2 2023; index: Q4 2019 = 100) |
(index) |
 |
 |
Sources: Eurostat, INE, S&P Global Market Intelligence and ECB calculations.
Notes: Panel a: the bankruptcy index provided by Eurostat for Spain shows a sizeable pickup in Spanish bankruptcies, driven largely by sole proprietors, the removal of the bankruptcy moratorium in June 2022 and the amended Spanish Bankruptcy Law which entered into force on 26 September 2022. To ensure comparability with the indices for other countries, the chart shows Spanish bankruptcies obtained from INE that exclude natural persons. The euro area aggregate is calculated using the INE data for Spain. Panel b: points show euro area countries for which sectoral PMIs are available. For the manufacturing PMI, these comprise the euro area aggregate, Germany, Ireland, Greece, Spain, France, Italy, the Netherlands and Austria; for the services PMI, they comprise the euro area aggregate, Germany, Ireland, Spain, France and Italy; and for the construction PMI, they comprise the euro area aggregate, Germany, France and Italy. Dots below the 45-degree line signal a deterioration between the two points in time. Values below 50 signal a contraction of output, values above 50 an expansion.
Overall, corporate vulnerabilities have increased as financial conditions have tightened and the economic outlook has weakened. There is considerable diversity across firms, despite them being resilient on average, as higher financing costs and a weakening macroeconomic outlook are now adding to the challenges they have faced over the past few years. The interest burden for corporates will likely increase further as debt has to be refinanced at higher rates once sources of internal funding have been depleted. In addition, some debt instruments, such as leveraged loans, are more sensitive to rate increases and might be particularly exposed should financial conditions tighten further. This means that the number of vulnerable firms that have difficulty servicing their debt is likely to increase. Accordingly, there could be more defaults going forward, with potential knock-on effects on bank balance sheets, non-bank investors in corporate debt (Chapter 4) and household employment prospects.
1.4 Households benefit from a strong labour market but face higher debt service costs
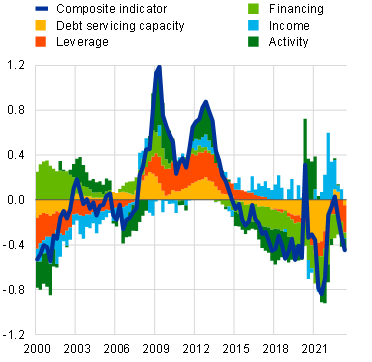
Euro area households continue to benefit from record levels of employment and, more recently, rising wages. Consumer confidence and households’ self-reported financial situations had been improving since the publication of the previous issue of the Financial Stability Review on the back of a very robust labour market and declining headline inflation. However, this improvement came to a halt in July 2023 before going into reverse and remaining markedly below pre-pandemic levels (Chart 1.8, panel a). After real compensation per employee suffered a substantial fall in 2022, negotiated wages have picked up significantly recently. While no concrete signs of the labour market turning have emerged as yet, the rate of change in the unemployment rate has flattened out in recent months and the number of people unemployed has slowly started to rise in some countries. The sound financial position of households overall is mirrored by the household vulnerability indicator, which stands below its long-run average (Chart 1.8, panel b).
Chart 1.8
Households benefit from a strong labour market, but prospects are subdued as initial signs of higher debt service costs emerge and the unemployment rate bottoms out
|
a) Consumer confidence, households’ expectations about their financial situation, and unemployment rate |
b) Composite indicator of household vulnerabilities |
|---|---|
|
(Jan. 2006-Oct. 2023, left-hand scale: indices, right-hand scale: percentages) |
(Q1 2000-Q2 2023, standard deviations from long-run average) |
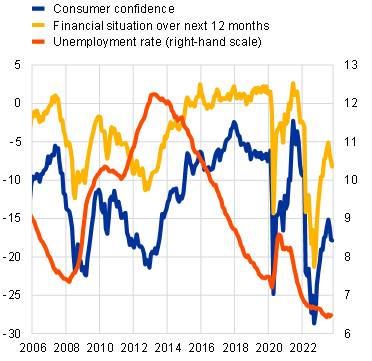 |
 |
Sources: European Commission, Eurostat, ECB and ECB calculations.
Notes: Panel a: the latest observation for the unemployment rate is for September 2023. Panel b: the composite indicator is based on a broad set of indicators along five dimensions: debt servicing capacity (measured by gross interest payments-to-income ratio, savings ratio and expectation of personal financial situation); leverage (gross debt-to-income and gross debt-to-total assets ratios); financing (bank lending rate, short-term debt-to-long-term debt ratio, quick ratio (defined as current financial assets/current liabilities) and credit impulse (defined as the change in new credit issued as a share of GDP)); income (real income growth and income-to-GDP ratio); and activity (labour participation rate and unemployment expectations). The indicators are standardised by transforming them into z-scores, i.e. they are converted into a common scale with a mean of zero and a standard deviation of one. Composite sub-indicators are calculated for each of the five dimensions by taking the simple arithmetic mean of the respective underlying z-scores of the individual indicators. Finally, the overall composite indicator is obtained by equally weighting the composite z-scores of the five sub-categories. Positive values indicate higher vulnerability, negative values lower vulnerability.
Household vulnerabilities are rising slowly due to deteriorating debt servicing capacity as higher policy rates feed through. The sharp decline in loan demand triggered by rising policy rates since 2022 has led to a drop in household leverage, reducing overall vulnerabilities. Similarly, the household vulnerability indicator’s activity component reflecting the strong labour market is contributing to declining vulnerabilities. The income component is reverting to neutral territory, as real wages are catching up. However, the recent deterioration in households’ debt servicing capacity is adding to aggregate vulnerabilities. The significant increase in the cost of borrowing in the euro area has recently started to have an impact on mortgage debt service costs. Variable-rate mortgages and fixed-rate mortgages at the end of their rate fixation period are being repriced at interest rates that are much higher than they were a year ago or at origination. Worse debt servicing capacities are also reflected in the recent increase in the interest debt service-to-income (IDSTI) ratio for the euro area (Chart 1.9, panel a), in particular for countries where variable-rate mortgages predominate, while for most traditionally fixed-rate countries the ratio remained largely unchanged (Special Feature B).
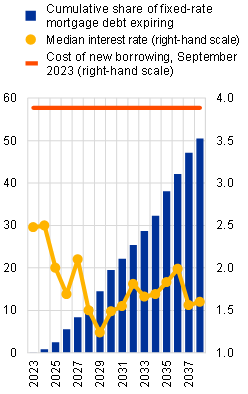
Chart 1.9
Euro area household sector buttressed by sufficient cash flows and savings, but increase in debt service cost will weigh on households’ financial situations
|
a) Interest debt service-to-income (IDSTI) ratio |
b) Share of illiquid households, by income quintile |
c) Wall of fixed-rate mortgage debt expiration |
|---|---|---|
|
(Q1 2003-Q2 2023, percentages) |
(2010-Q2 2023, percentages) |
(2023-38, percentages) |
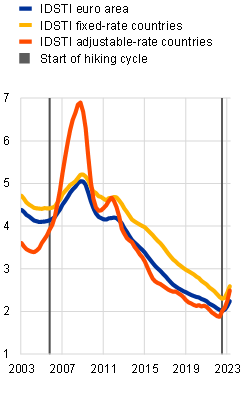 |
 |
 |
Sources: ECB (nowcasted Household Finance and Consumption Survey) and ECB calculations.
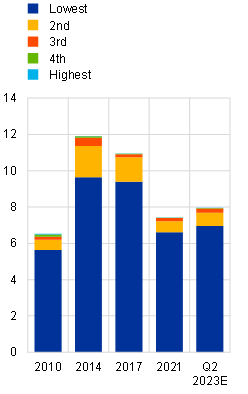
Notes: Panels b and c: the nowcasting methodology brings the most recent survey data from 2021 forward to Q2 2023 by micro-simulating the development of individual households’ incomes, savings, expenditures and debt holdings according to aggregate macro-financial data. Structural shifts in aggregate employment and mortgage origination patterns are taken into account. A household is defined as illiquid when its income cash flow is negative after all expenses and its savings do not cover more than one month of total debt service.
Households remain solvent despite first signs of higher debt service costs on variable-rate loans, while fixed-rate loans could pose a problem down the line. Micro-simulations using household survey data nowcasted to the first quarter of 2023 reveal that the share of households with a debt service-to-gross-income ratio of above 30%, which indicates elevated risk of default, increased from 12% to 14% between the first quarter of 2022 and the second quarter of 2023. In some countries with a share of variable-rate mortgages that is very high by historical standards, the increase has been even greater. At present, however, the micro-simulations do not show signs of a substantial increase in the share of illiquid households, as free cash flows – supported by the tight labour market – and savings buffers – supported by legacy excess savings from the pandemic – have not yet become impaired (Chart 1.9, panel b). During the period of ultra-low interest rates, households originated and refinanced large volumes of mortgages at very favourable conditions. That said, estimates based on nowcasted survey data show that over 30% of the euro area’s outstanding fixed-rate mortgage stock is expected to expire within the next ten years (Chart 1.9, panel c). These mortgages have median interest rates of between 1.5% and 2.0%, and debt service payments would have to be recalculated at market rates when the interest rate fixation expires. Depending on the future average cost of borrowing at the time, this repricing could result in a significant surge in debt service costs in countries where fixed-rate mortgages predominate. Since inflated house prices have driven up mortgage volumes substantially in several countries, even more affluent households may become financially stretched by increasing total debt service costs.[7]
1.5 Euro area residential and commercial real estate markets are experiencing a downturn
Euro area residential real estate (RRE) prices exhibited a year-on-year decline in the second quarter of 2023. The steep increase in borrowing costs since the beginning of the tightening cycle has had a negative impact on the demand for mortgages, leading to a sharp drop in new lending. The general level of interest rates, the reduction in consumer confidence and deteriorating housing market prospects are the main drivers behind the dwindling demand for housing loans. In line with falling new lending, euro area RRE price growth declined from 9.2% in the second quarter of 2022 to -1.7% in the second quarter of 2023. Model-based evidence suggests that monetary policy tightening is the main factor putting downward pressure on house prices, followed by changes in household preferences and tighter bank credit standards (Special Feature B). Although euro area RRE price dynamics only recently turned negative, prices had already started declining in some euro area countries in the second half of 2022. High-frequency data suggest that the pace of the decline in RRE prices has slowed over recent months (Chart 1.10, panel a), indicating a price correction that has been orderly so far.[8] Euro area rental prices, on the other hand, are rising at a record pace – in September 2023 they were up 2.7% year on year.
Chart 1.10
|
a) High-frequency RRE prices in selected countries |
b) Overvaluation estimates across euro area countries |
|---|---|
|
(Dec. 2019-Aug. 2023; index: December 2019 = 100) |
(Q4 2019, Q2 2022, Q2 2023; percentages) |
 |
 |
Sources: ECB, Europace, Eurostat, Immobiliare.it, Meilleursagents.com, Confidencial Imobiliário, Arco Real Estate, Národná banka Slovenska, Statistics Finland, Irish Central Statistics Office and Statistics Netherlands.
Notes: Panel a: the chart includes monthly data up to August 2023 for the following countries: Germany, Finland, France, Ireland, Italy, Latvia, Portugal and the Netherlands. For Slovakia, data are quarterly and up to June 2023. An average listing price index is used for Italy, while a hedonic price index based on transaction prices is used for all the other countries. Panel b: the chart shows deviations from the long-term average of the house price-to-income ratio, which constitute an indication of potential overvaluation in domestic housing markets. The long-term average is calculated from Q1 1996 to the respective end quarter. The average of two measures (inverted demand econometric model and house price-to-income ratio) was employed in previous editions of the Financial Stability Review, but the inverted demand model might underestimate overvaluation in a period of high inflation due to its use of real interest rates. Accordingly, the house price-to-income ratio is being employed as the benchmark overvaluation measure in the current edition of the Financial Stability Review.
RRE valuations are still above pre-pandemic levels in several euro area countries, suggesting that vulnerabilities remain elevated. RRE prices grew at a fast pace during the coronavirus (COVID-19) pandemic, rising significantly quicker than household incomes, which, in turn, pushed up estimated valuations of housing prices. These remain significantly above pre-pandemic levels, despite the fall in RRE prices witnessed thus far in some euro area countries (Chart 1.10, panel b).[9] Higher interest rates are likely to result in further downward pressure on house prices as they weigh on demand for new loans, while the debt servicing capacity of households with outstanding mortgages could deteriorate (Section 1.4). This is especially the case in countries where valuations are stretched, debt levels are elevated, or household mortgage debt is largely composed of variable-rate loans. Indeed, banks still expect the demand for housing loans to decline in the fourth quarter of 2023, but at a slower pace than in the previous five quarters. Together with supply-side shortages and high construction prices, this might contain the fall in RRE prices in the near term.
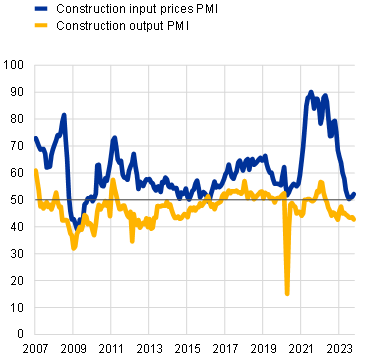
The outlook for commercial real estate (CRE) firms has continued to deteriorate in a context of falling tenant demand and negative credit rating actions. Transaction activity in CRE markets remains subdued (-47% in the first half of 2023 compared with the first half of 2022), although this may change in the coming quarters as the future path of interest rates becomes clearer. Any increase in market activity will aid price discovery but may result in significant declines in transaction prices as the market prices in a year of monetary policy tightening. The effects of this tightening are amplified by falling demand for CRE assets in the wake of the pandemic, with demand for office space dropping significantly over the course of 2023 (Chart 1.11, panel a). This dual challenge has driven significant credit rating activity for real estate firms over recent months. For example, S&P has downgraded 22% of European real estate firms since 2022 and a further 26% are on negative outlook. Looking at the combined actions of all credit rating agencies, market analysts estimate that €6 billion of bonds issued by European real estate firms were downgraded to high yield between May and August this year and that a further €10 billion in bonds remain vulnerable. Conditions are particularly challenging for property developers, who face falling sales prices, contracting order books and rising input costs, although price pressure from input materials has reduced in recent months (Chart 1.11, panel b). These factors resulted in a number of smaller German developers filing for bankruptcy in September. Construction sector PMIs have deteriorated in recent months, although they remain far above the lows seen during the pandemic and the global financial crisis (Chart 1.11, panel b).
The implications of the ongoing real estate correction for financial stability critically depend on the extent to which tighter financial and credit conditions reduce real estate demand and affordability. The downward adjustment in RRE prices has so far taken place in an orderly manner. However, risks remain tilted to the downside, especially in those countries where debt levels are elevated and properties might be overvalued. The commercial segment has seen a steeper downturn, and the combination of rising financing costs and falling rental incomes could pose repayment capacity challenges. Despite negative credit rating actions, so far there is limited evidence of credit supply restrictions, fire sales or a widespread deterioration in credit quality among CRE firms. Banks’ aggregate exposures are substantially smaller for CRE than for RRE and are unlikely to be large enough at the euro area level to cause a systemic crisis alone. Nevertheless, a scenario where real estate firms suffer very large losses is likely to coincide with stress in other sectors. In this way, CRE market outcomes have the potential to act as a significant amplifying factor in an adverse scenario, increasing the likelihood of systemically relevant losses accruing in the banking system (Special Feature B). While macroprudential policy should focus on maintaining the resilience of the banking sector at the current juncture, current levels of banking sector profitability may provide an opportunity for further targeted increases of macroprudential buffers in some countries while avoiding procyclical effects (Chapter 5).
2.1 Markets adjust to an environment of higher rates
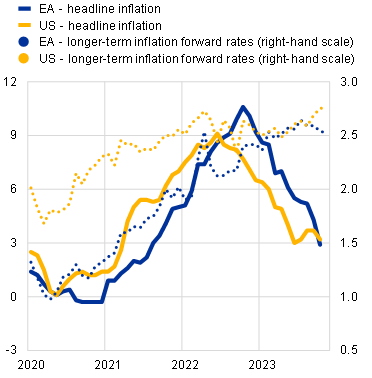
Market participants’ view that there is a heightened risk of persistent inflation has led them to revise their expectations for interest rates to remain elevated for a longer period of time. Falling inflation (Chart 2.1, panel a) has encouraged major central banks to moderate the pace of policy rate hikes. In addition, the prospect of nearing the end of the rate-hiking cycle lowered the implied volatility in risk-free interest rate markets and supported investor sentiment until August. At the same time, however, longer-term inflation swap forward rates have stayed elevated (Chart 2.1, panel a), as resilient labour markets, the energy transition, climate change and heightened geopolitical tensions may contribute to greater inflation persistence and economic uncertainty.[10] Consequently, market participants have also adjusted their expectations regarding the future path of short-term interest rates and have priced them as remaining at elevated levels for an extended period of time (Chart 2.1, panel b). Over September and October a rapid increase in long-term government bond yields in line with this trend, as well as on the back of rising term premia, put renewed pressure on asset valuations. However, the market correction proved to be short-lived, as investor confidence benefited from a downside surprise in inflation.
Chart 2.1
Investor expectations of inflation persistence have led them to price in higher-for-longer rates
|
a) Headline inflation and longer-term inflation swap forward rates |
b) Market-implied short-term interest rate expectations |
|---|---|
|
(Jan. 2020-Nov. 2023, annual percentage changes) |
(percentages) |
 |
 |
Sources: Bloomberg Finance L.P. and ECB calculations.
Notes: The latest observations are for 14 November 2023. Panel a: longer-term inflation swap forward rates refer to 5Y5Y swaps on HICP (euro area) and CPI (United States). Panel b: risk-neutral market expectations for one-month rates based on the €STR OIS and the USD SOFR OIS forward curves.
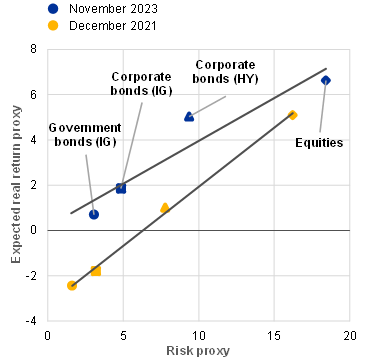
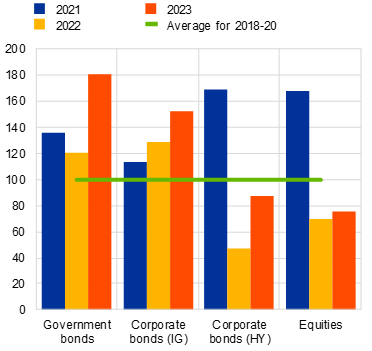
A period of higher interest rates may bring long-term benefits for the stability of the financial system, but it could also temporarily increase market volatility. The era of ultra-low interest rates was associated with an accumulation of financial stability risks.[11] In financial markets, these risks were linked primarily to search-for-yield behaviour, resulting in increased leverage and exposure to risky assets and causing a build-up of market and credit risks that in some cases may have exceeded risk-bearing capacities.[12] As a result, the transition to a higher interest rate environment has triggered a reversal which is visible in de-risking trends as safer assets have become increasingly appealing to investors (Chart 2.2, panel a). Net flows into investment funds exposed to riskier asset classes have also been substantially lower (Chapter 4). The crowding out of riskier assets has so far mostly been evident in primary market volumes, with the gross issuance of euro area high-yield bonds and equities declining considerably during the normalisation of monetary policy (Chart 2.2, panel b). In the secondary market, the rise in real risk-free rates has induced a correction in equity prices, albeit of limited extent to date. Such resilience may be attributed partly to reduced supply from new issuance, on top of the robust demand stemming from the soft-landing expectations or from investors who see equities as a better inflation hedge than fixed income securities. Going forward, compressed risk premia leave global equity markets vulnerable to disorderly repricing if risk sentiment deteriorates. Such correction could be exacerbated by heightened leverage in the equity options market (Box 2).
Chart 2.2
The transition to a higher interest rate environment has reduced the issuance of riskier assets
|
a) Real return and risk metrics for euro-denominated asset classes |
b) Changes in gross issuance of securities by euro area entities |
|---|---|
|
(percentages) |
(Jan.-Nov., 2018-23; average for 2018-20 = 100) |
 |
 |
Sources: Bloomberg Finance L.P. and ECB calculations.
Notes: The latest observations are for 14 November 2023. IG stands for investment grade; HY stands for high yield. Panel a: calculated on the basis of Bloomberg euro-denominated total return bond indices for three- to five-year maturities and on the EURO STOXX Index. Expected real returns are proxied by the weighted average yield to maturity adjusted by inflation swap rates on the euro area HICP matching index average maturity (for debt indices) and by the five-year cyclically adjusted price-to-earnings (CAPE) yield (for the equity index). Risk is proxied by the rolling five-year annualised volatility of monthly returns. Fitted lines are linear functions. Panel b: rating groups are based on the average rating assigned to a given issuer.
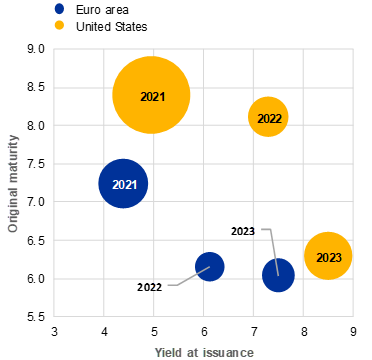
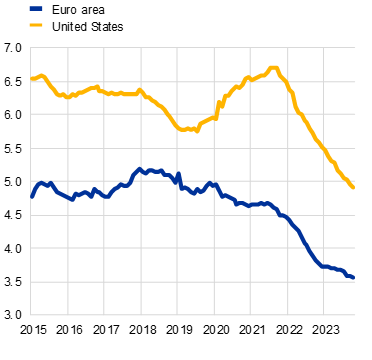
The impact of policy tightening on riskier borrowers may be greater in the medium term. Lower-rated corporate borrowers issued a record amount of debt shortly before the onset of the tightening cycle (Chart 2.2, panel b). This may have enabled them to reduce issuance in 2022 and 2023 to some degree, which shielded them from the immediate effects of higher risk-free rates and wider spreads on their funding costs. Some firms which still opted for market-based funding have issued new bonds but with shorter maturities, potentially aiming to lower the risk premia demanded by investors or hoping that monetary policy would ease faster than currently anticipated (Chart 2.3, panel a). These two trends have recently caused the average maturity of outstanding high-yield debt to fall to historical lows (Chart 2.3, panel b). While such debt management strategies could prove beneficial for borrowers if tight monetary policy is short-lived, they might increase rollover risks, especially in a higher-for-longer environment. In particular, shorter debt maturities leave lower-rated firms more exposed to future market conditions. If a delay in the impact of policy tightening on funding costs coincides with an already slowing economy, this could lead to a further rapid decline in interest coverage ratios (Chapter 1) and cause a disorderly price correction in the high-yield bond market.
Chart 2.3
High-yield issuers are increasingly exposed to refinancing risk
|
a) High-yield bond issuance characteristics |
b) Average remaining maturity on outstanding high-yield bonds |
|---|---|
|
(2021-23 year to date; percentages, years) |
(Jan. 2015-Nov. 2023, years) |
 |
 |
Sources: Bloomberg Finance L.P. and ECB calculations.
Notes: The latest observations are for 14 November 2023. Panel a: bubble size is scaled to reflect the notional amount of debt issued. Average characteristics are weighted by the amount issued. The calculation of average original maturity excludes perpetual bonds. Panel b: average maturity for the ICE BofA Euro High Yield Index (euro area) and the ICE BofA US High Yield Index (United States).
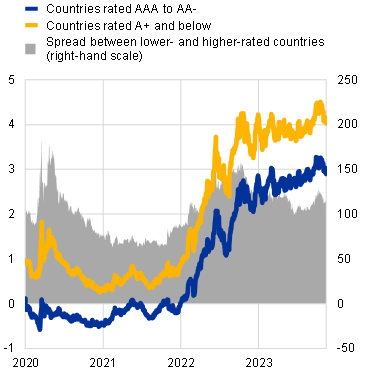
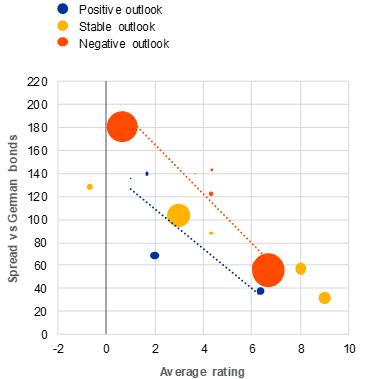
Vulnerabilities are also persisting in sovereign bond markets due to the continued rise in risk-free rates and subdued economic growth. The period of ultra-low interest rates led to a gradual decline in the cost of public debt and reduced disparities in funding costs between euro area countries despite rating differences (Chart 2.4, panel a). The reversal of this trend since summer 2022 has been only gradual so far. It could, however, gain momentum, particularly as more vulnerable countries are confronted by substantial rollover needs in the near term (Chapter 1). At present it would appear that sovereign spreads are increasingly reflecting differences in country ratings and the outlook for these ratings, with more euro area sovereign debt at risk of a downgrade than an upgrade (Chart 2.4, panel b). Going forward, some euro area countries may experience significant spread widening if they are unable to consolidate their fiscal positions, although this may prove challenging given the ongoing economic slowdown. At the same time, the flexibility in the ECB’s pandemic emergency purchase programme reinvestments and the ECB’s Transmission Protection Instrument could mitigate unwarranted disorderly sovereign debt market dynamics that could pose a serious threat to the transmission of monetary policy across the euro area, if the programme conditions are fulfilled.
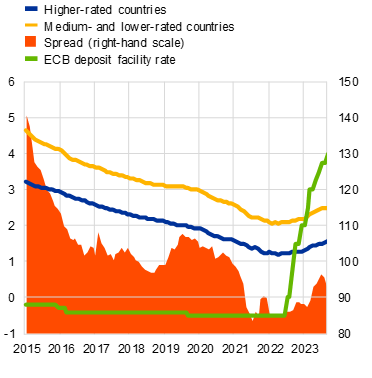
Chart 2.4
Higher interest rates might strengthen market discipline of fiscal policies
|
a) Sovereign financing costs, by rating, and ECB deposit facility rate |
b) Spreads for euro area sovereigns, by average rating and rating outlook |
|---|---|
|
(Jan. 2015-Sep. 2023; left-hand scale: percentages, right-hand scale: basis points) |
(14 November 2023; notches above investment-grade threshold, basis points) |
 |
 |
Sources: Bloomberg Finance L.P., ECB (CSDB), Fitch Ratings, Moody’s Analytics, S&P Global Market Intelligence and ECB calculations.
Notes: Panel a: average yield at issuance for outstanding sovereign debt. “Medium and lower-rated countries” are defined here as those having at least one credit rating below Aa3 (Moody’s) or AA- (Fitch and S&P). Other euro area countries are considered to be higher rated. The spread shows the difference in average yield at issuance for the two groups indicated in the chart. Panel b: the highest possible rating (AAA/Aaa) equals 9. The fitted lines are linear functions for countries with positive (blue) and negative (red) outlooks. Average rating from Fitch, Moody’s and S&P. Bubble size is scaled to reflect the notional amount of debt outstanding as at the end of September 2023.
Disruptions in the supply of energy commodities could push inflation up again and contribute to market volatility. The euro area has seen wide swings in the price of natural gas over the last two years and there is still considerable uncertainty surrounding future prices. Europe’s heavy reliance on liquified natural gas has rendered natural gas prices highly vulnerable to potential supply disruptions. Implied volatility metrics also indicate that risks are tilted to the upside. In addition, oil prices have risen since July 2023 on the back of concerns about reduced supply. Volatility in energy commodity prices might also rapidly increase in response to growing geopolitical tensions. A renewed energy price shock, triggered by geopolitical tensions in the Middle East for example, could lead to more persistent inflation, induce an adjustment in market-based interest rate expectations and further weaken economic growth. This could potentially lead to renewed market corrections.
Box 2
The risks from hidden leverage in short-term equity options
Option trading volumes in the euro area equity market could increase significantly in the coming quarters in response to the broader offer of such instruments. In the United States, there has been growing interest in trading S&P 500 options on the day of their expiry (commonly referred to as “0 days to expiry” or “0DTE”). In response, the Cboe Exchange has expanded the offer of these options by adding expiration dates to include every business day.[13] Since then, trading volumes for options on the S&P 500 have soared (Chart A, panel a). Recently they reached an all-time high, with 0DTE options accounting for more than 50% of total option volumes for this index. In anticipation of similar investor interest in trading 0DTE options in the euro area equity market, on 28 August 2023 EUREX expanded the offer of weekly options on the EURO STOXX 50 to also cover every business day.
2.2 Investors may be underestimating the risk of a slowdown in economic growth
Elevated economic uncertainty could also lead to a surge in market volatility. Various shocks – such as credit events – can occur unexpectedly, while vulnerabilities tend to become more pronounced towards the end of a tightening cycle. Currently, the low levels shown by market-based risk indicators suggest that the baseline expectation among investors is that the economy will experience a soft landing, meaning that inflation will decline towards central bank targets without an accompanying recession.[14] Nevertheless, the historical evidence indicates that a benign scenario of this type is difficult (although not impossible) to achieve in practice, especially given the magnitude of rate increases in a short period of time.[15] This underscores the fact that there are material risks surrounding current market pricing. In both the euro area (Chart 2.5, panel a) and the United States (Chart 2.5, panel b), market volatility and risk premia have tended to increase after a hiking cycle has concluded, albeit with different time lags. The potential underestimation of risk by market participants could therefore lead to a disorderly correction if there are any negative economic surprises or if market sentiment turns.
Chart 2.5
Economic uncertainty might lead to a spike in market volatility after rate hikes end
|
a) Equity market-implied volatility and corporate bond spread around the end of hiking cycles in the euro area |
b) Equity market-implied volatility and corporate bond spread around the end of hiking cycles in the United States |
|---|---|
|
(Oct. 1998-July 2013; left-hand scale: index, right-hand scale: basis points) |
(Jan. 1993-Dec. 2020; left-hand scale: index, right-hand scale: basis points) |
 |
 |
Sources: Bloomberg Finance L.P. and ECB calculations.
Notes: While the sample is limited and not every increase in the risk indicators was directly associated with monetary policy, a tighter policy stance might have impacted the scale of market volatility. Panel a: average values observed over the previous three hiking cycles. Option-adjusted spreads for ICE BofA Euro Corporate index. Panel b: average values observed over the previous four hiking cycles. Option-adjusted spreads for the Bloomberg US Corporate Bond index.
The equity risk premium may be excessively compressed in the light of the weak macroeconomic outlook for the euro area. As the effects of monetary policy tightening transmit throughout the economy, a notable deterioration in growth prospects for the euro area is evident in economic forecasts and several leading indicators of economic activity (Chapter 1). Historically, the prospect of economic contraction has typically led to a substantial widening of risk premia as market participants demand higher compensation for taking risks in an environment in which corporate profits are expected to decline and default rates are expected to increase. In the past, this relationship has shown greater sensitivity for riskier assets. In recent months, however, risk premia in the euro area corporate bond market (Chart 2.6, panel a) and equity market (Chart 2.6, panel b) have remained largely unchanged, despite a substantial decline in the composite Purchasing Managers’ Index (PMI) and its indications of economic contraction. Furthermore, although the level of risk premia in the corporate bond market still appears to be fairly well aligned with historical patterns, it is significantly compressed in the equity market. This will render equities vulnerable to abrupt repricing if the adverse effect of the economic slowdown on corporate profitability is greater than currently anticipated by investors.
Chart 2.6
The response of risk premia to the worsening growth outlook has so far been limited
|
a) Risk premium in the euro area corporate bond market and Composite PMI |
b) Risk premium in the euro area equity market and Composite PMI |
|---|---|
|
(Jan. 2012-Oct. 2023; index, basis points) |
(Jan. 2012-Oct. 2023; index, percentages) |
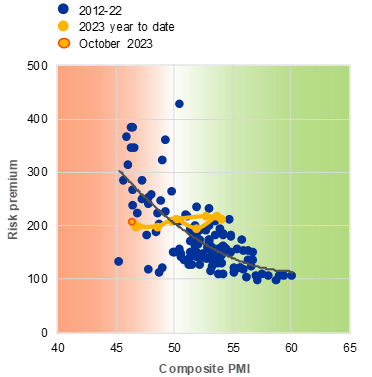 |
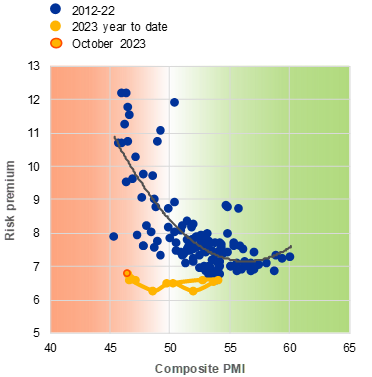 |
Sources: Bloomberg Finance L.P., S&P Global Market Intelligence and ECB calculations.
Notes: Composite PMI below 50 indicates economic contraction (red area) while above 50 indicates economic expansion (green area). The fitted lines are quadratic functions and exclude the first three months of pandemic-related lockdown (March-May 2020) as outliers. Panel a: credit risk premia are calculated as the option-adjusted spread for BBB-rated corporate bonds with a residual maturity of five to seven years. Panel b: equity risk premia are calculated as the five-year CAPE yield for the EURO STOXX less the five-year real (inflation-swap-adjusted) German government bond yield.
China’s economic slowdown may also act as a drag on growth in the euro area and may adversely affect market sentiment. The reopening of the Chinese economy offered only temporary relief from concerns surrounding the local real estate market. Credit spreads for bonds issued by property developers spiked again to severely distressed levels as an increasing number of them found it difficult to meet their debt obligations (Chart 2.7, panel a). Furthermore, Chinese banks have seen their valuations plummet to historic lows, given that they hold vast majority of debt exposure to property developers. The substantial contribution made by the real estate sector to China’s GDP[16] means that a downturn in the property market, coupled with subdued consumer confidence, could significantly impede overall economic growth in the country for an extended period. This risk would become even more pronounced if credit losses incurred by exposed banks led to a severe tightening of lending standards or, worse, a financial crisis also involving domestic shadow bank trusts. Although euro area entities have limited direct securities exposure to Chinese companies, potential spillover effects could emerge due to China’s prominent role in the global economy. Macroeconomic shocks in China could therefore have a material impact on global financial markets.[17] While the correlations between the Chinese equity market and markets in advanced economies weakened when inflation surged around the world, they have rebounded over the course of 2023 (Chart 2.7, panel b). For this reason, further negative surprises in China may have adverse effects on financial conditions in the euro area as well.
Chart 2.7
Vulnerabilities in China could spill over to advanced economies
|
a) Spreads in the Chinese corporate bond market |
b) Equity market correlations between China and advanced economies |
|---|---|
|
(Jan. 2019-Nov. 2023, basis points) |
(Jan. 2019-Nov. 2023, percentages) |
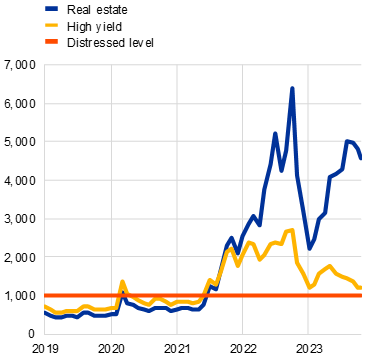 |
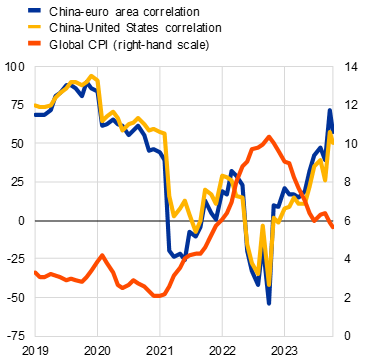 |
Sources: Bloomberg Finance L.P. and ECB calculations.
Notes: The latest observations are for 14 November 2023. Panel a: option-adjusted spreads for the ICE 1-5 Year USD China Senior Real Estate Corporate Constrained Index and the ICE BofA Asian Dollar High Yield Corporate China Issuers Index. Panel b: rolling 12-month correlation for monthly returns on EURO STOXX (euro area), S&P 500 (United States) and MSCI China (China).
2.3 Rapid adoption of artificial intelligence might also have financial stability implications
Progress in developing artificial intelligence has sparked euphoria among investors. Since May, the equity market in the United States has strongly outperformed that of the euro area, partly due to more positive macroeconomic surprises (Chart 2.8, panel a). However, robust economic data in the United States have also led investors to expect policy rates to remain higher for longer (Chart 2.1, panel b), contributing to the substantial increase in long-term nominal and real risk-free rates. While the surge in these rates played a major role in the market correction in 2022, valuations of US companies have increased in 2023 despite the continued rise in real rates (Chart 2.8, panel b). This market rebound has been concentrated in the technology sector. As the shares of such high-growth companies are considered to be long-duration assets, their prices should be particularly sensitive to interest rate levels. Nevertheless, progress in adopting artificial intelligence (AI) has pushed equity valuations higher on the back of investors’ optimism about future earnings in companies judged likely to benefit from these new technologies.
Chart 2.8
Stronger economic outlook and AI advances have led US equity valuations higher
|
a) Relative performance of equity markets and macroeconomic surprises in the United States and the euro area |
b) Valuation of the S&P 500 against long-term real risk-free rates |
|---|---|
|
(1 Jan.-14 Nov. 2023; left-hand scale: index spread, |
(Jan. 2015-Nov. 2023; left-hand scale: ratio, right-hand scale: percentages) |
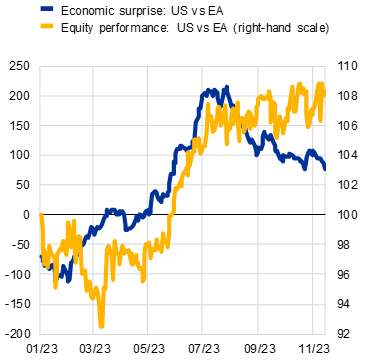 |
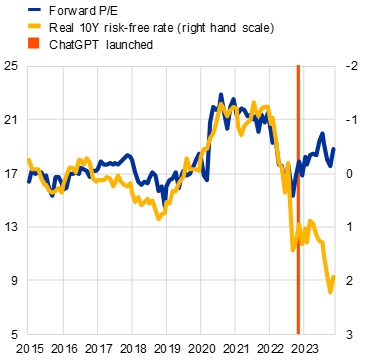 |
Sources: Bloomberg Finance L.P. and ECB calculations.
Notes: Panel a: “Economic surprise” shows the difference between the Citi Economic Surprise Index for the United States and for the euro area. “Equity performance” shows the normalised ratio of S&P 500 (United States) and EURO STOXX (euro area). Panel b: the latest observations are for 2 November 2023. Price to one-year blended-forward earnings and ten-year real (inflation-swap-adjusted) government bond yield.
Potential overvaluation in the US equity market could have repercussions for financial markets in the euro area. Numerous equity valuation metrics in the United States reached decade-high levels during the summer, prompting concerns of overvaluation (Chart 2.9, panel a) or even an AI-related asset price bubble.[18] By contrast, euro area equity valuation indicators did not increase to such levels (Chart 2.9, panel a), partly because of the much smaller share of technology companies. Financial stability risks for the euro area from their potential overvaluation therefore relate mostly to spillovers from the United States. The deep integration of the two equity markets is evidenced by the very high correlation of returns, which typically becomes even stronger during periods of stress (Chart 2.9, panel b).[19] Apart from real-economy linkages, these strong correlations might also stem from the level of similarity between the portfolios of global investors, which could have increased partly on account of the digitalisation of financial services (Box 3) and the growing share of passive investing. A disorderly correction in the US equity market could therefore affect euro area entities via large direct exposures, which amounted to €2.6 trillion in the second quarter of 2023[20], and via the transmission of negative sentiment to euro area markets.
Chart 2.9
Potential overvaluation in the US equity market also poses a risk for euro area markets
|
a) Equity market composite valuation metric relative to the ten-year average |
b) Volatility indices and correlations between equity markets in the euro area and the United States |
|---|---|
|
(Jan. 2021-Nov. 2023, z-scores) |
(Jan. 2019-Nov. 2023; left-hand scale: index, right-hand scale: percentages) |
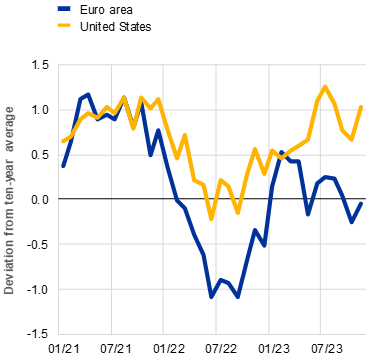 |
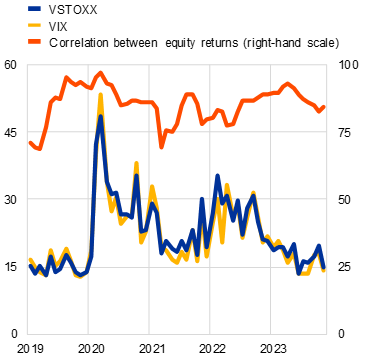 |
Sources: Bloomberg Finance L.P. and ECB calculations.
Notes: The latest observations are for 14 November 2023. Panel a: average z-scores of the following valuation metrics for EURO STOXX (euro area) and the S&P 500 (United States): price-to-book ratio, price-to-forward (twelve-month) earnings ratio, price-to-long-term (ten-year) inflation-adjusted earnings ratio, price/earnings-to-growth ratio (growth rate calculated as the average of annualised five-year historical earnings growth and annualised two-year blended-forward earnings growth) and inverse risk premia proxied by five-year CAPE yield less five-year real (inflation-swap-adjusted) government bond yield (German for the euro area). Panel b: VSTOXX and VIX are implied volatility indices based on options on the EURO STOXX 50 and on the S&P 500 respectively. Rolling 12-month correlation for monthly returns for EURO STOXX 50 and the S&P 500.
The risk of technology-led asset price overvaluation warrants a thorough financial stability assessment. Concerns over a potential AI-related asset price bubble have prompted comparisons with the dotcom bubble. Research indicates that the dotcom crash did not have wider macroeconomic consequences.[21] However, the companies around which bubble-type concerns are arising today are substantially larger in size.[22] At the same time, the distribution of the most common equity valuation metrics was much more extreme at the peak of the dotcom bubble than is currently the case (Chart 2.10, panel a). Nevertheless, continuous monitoring is warranted, as systemic risk builds up when valuations are still increasing.[23] Given the fact that credit-fuelled bubbles are often seen as more detrimental for financial stability, it is also crucial to assess how various forms of leverage and the associated risk of illiquidity spirals could affect financial institutions and broader financial markets.
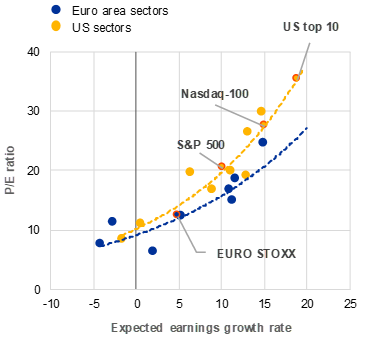
The anticipation of high earnings growth related to AI adoption might lead to increased price volatility and the risk of a disorderly market correction. During the course of 2023, earnings expectations have increased substantially for companies expected to benefit most from AI adoption. Such expectations might be justified if AI significantly enhances productivity. At the same time, though, the non-linear correlation between valuation metrics and earnings growth expectations (Chart 2.10, panel b) leaves the largest US companies vulnerable to sudden repricing. Elevated uncertainty surrounding the ultimate impact of AI could therefore also contribute to high volatility in the equity market, irrespective of whether the “AI rally” displays asset price bubble dynamics or not.
The widespread adoption of AI, while offering many benefits, may also introduce new risks to market functioning. Market participants in the euro area are increasingly using AI in investment strategies, risk management, compliance, data analysis and post-trade processes.[24] However, there are concerns around the potential manipulative use of AI, such as the ability to influence market sentiment through social media.[25] The relevance of this risk transmission channel was underscored in March 2023 when social media activity likely accelerated the failure of Silicon Valley Bank (Box 3).[26] In addition, the proliferation of similar AI models in portfolio management could exacerbate herding behaviour and increase market procyclicality.[27]
Box 3
Financial stability considerations arising from the digitalisation of financial services
The digitalisation of financial services brings a variety of benefits but could also amplify and accelerate the materialisation of financial stability risks. The surge in retail investors participating directly in equity markets during the pandemic was associated with increased access to capital markets via trading apps (Chart A, panel a). This trend has certainly brought some benefits, for example by broadening risk sharing and lowering transaction costs. Nonetheless, authorities’ attention was drawn to episodes of extreme volatility in the prices of “meme” stocks[28] in the first half of 2021, which had been induced by individual investors coordinating trades through social media.[29] Furthermore, the banking sector stress in the United States in March 2023 reignited concerns around the impact of digitalisation on financial stability, as the interaction of increased online banking (Chart A, panel b) and social media may accelerate the pace of bank runs.
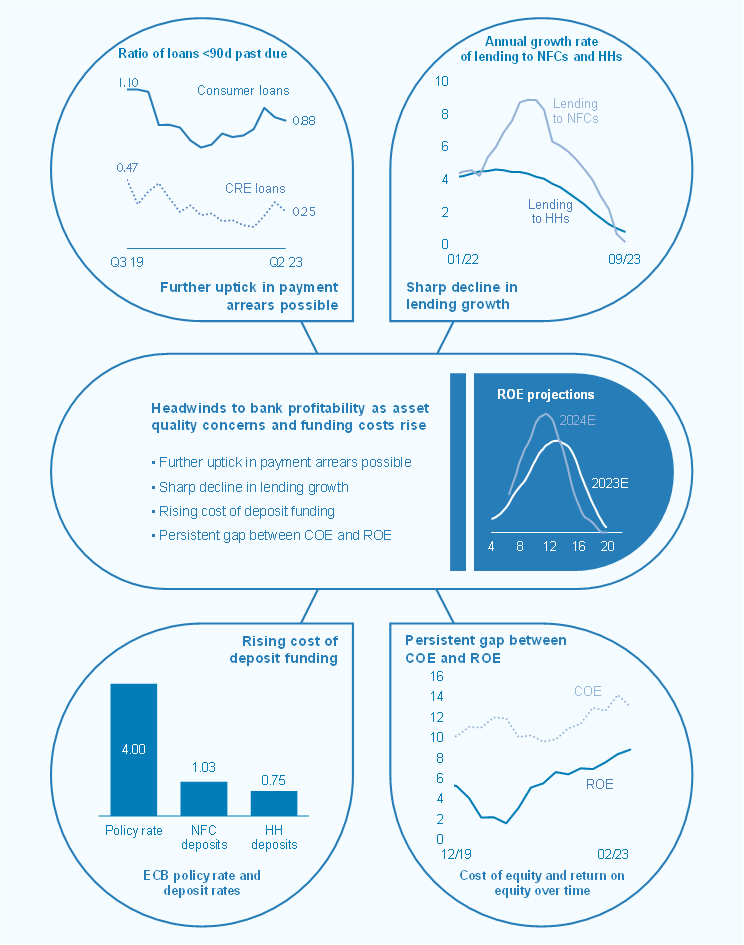
3.1 Profitability at multi-year heights, but headwinds grow
The widening of interest margins has continued to boost the profitability of euro area banks to record levels. The four-quarter trailing return on equity (ROE) of euro area significant institutions has gone on rising in 2023 and reached 8.9% in the second quarter, a level last seen 15 years ago (Chart 3.1, panel a).[30] The improvements in ROE seen since the end of 2022 have been driven mostly by higher net interest income (NII) (Chart 3.1, panel b). While higher lending volumes were the main driver of NII growth in the first quarter, margin expansion was the key factor behind improved NII levels in the second quarter. In some countries, such as France and Germany, other operating profits relating to trading activities accounted for the bulk of the changes in ROE. Third quarter earnings releases of listed banks suggest that the profitability of euro area banks remained almost unchanged.
Chart 3.1
Bank profitability has reached levels last seen 15 years ago, on the back of rising net interest income
|
a) ROE, COE and market valuation of euro area banks |
b) Decomposition of changes in significant institutions’ ROE, operating profits and net interest income |
|---|---|
|
(Q1 2001-Q2 2023, percentages) |
(Q3 2022-Q2 2023, percentages, percentage points) |
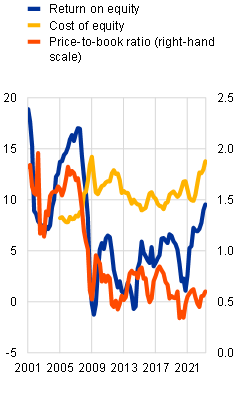 |
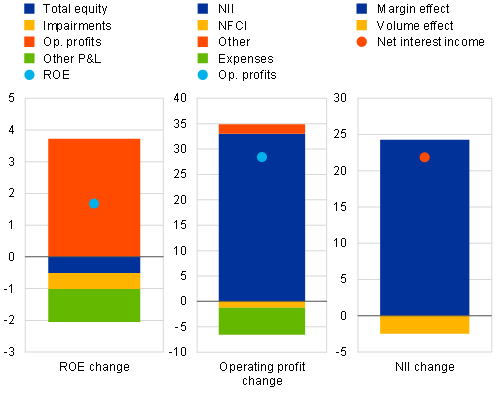 |
Sources: Bloomberg Finance L.P., ECB (supervisory data) and ECB calculations.
Notes: Panel a: ROE and price-to-book ratio are calculated on the basis of a balanced sample of 19 euro area banks. COE stands for cost of equity. Altavilla et al.* estimate the COE of euro area banks as an average across ten different models (five implied COE models and five factor models), which are estimated for individual listed euro area banks and then weighted by market capitalisation. Panel b: based on a balanced sample of 81 euro area significant institutions. NFCI stands for net fee and commission income.
*) Altavilla, C., Bochmann, P., De Ryck, J., Dumitru, A., Grodzicki, M., Kick, H., Melo Fernandes, C., Mosthaf, J., O’Donnell, C. and Palligkinis, S., “Measuring the cost of equity of euro area banks”, Occasional Paper Series, No 254, ECB, 2021.
Differences in pass-through of policy rates explain most of the dispersion of interest margins across euro area countries. Interest margins have taken different paths across loan segments and euro area countries since the start of the hiking cycle last year. While total net interest margins (NIMs) have remained below pre-pandemic levels for the euro area overall, the NIM for corporate lending climbed to new heights as loans to non-financial corporations (NFCs) are granted predominantly at variable rates. By contrast, aggregate NIMs for lending to households continued to decline for the euro area, which illustrates the implications for bank profitability of mortgage lending at fixed interest rates during the period of ultra-low interest rates (Chart 3.2, panel a). Indeed, the share of variable-rate lending and the sensitivity of deposit rates to ECB policy rates (the “deposit beta”) are two major factors explaining the margin differences across euro area countries (Chart 3.2, panel b).
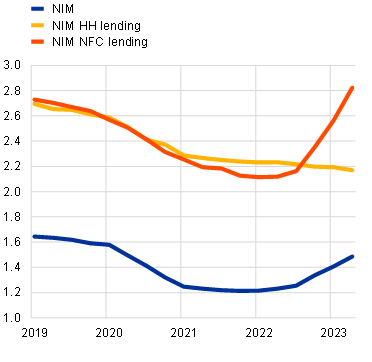
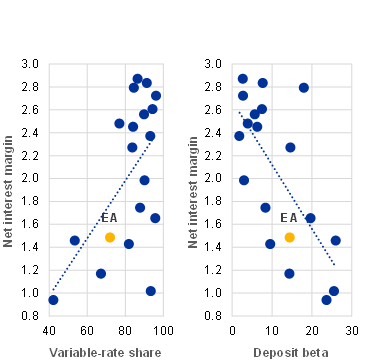
Looking forward, downside risks are growing for banks on the back of asset quality concerns, muted lending dynamics and rising funding costs. While banks have so far largely benefited from higher interest rates, going forward their profits are likely to be constrained by three factors. First, the combination of higher living costs, higher debt service costs and a deteriorating macroeconomic environment could eventually have an adverse impact on bank asset quality. Second, higher lending rates, lower loan demand and tighter credit standards have led to a substantial drop in lending volumes, which will weigh on bank profitability. Finally, compared with past hiking cycles, the pass-through of rate hikes to depositors has been more limited for overnight deposits, partly due to the ample level of excess liquidity in the system and the abundance of overnight deposits without regulatory value for banks. Banks’ currently strong profitability is likely to come under pressure as their funding costs catch up with the interest rates paid on new business and their funding composition continues to shift towards more expensive sources. Indeed, market analysts expect ROE to decline slightly by 2024 (Chart 3.3, panel a); moreover, these expectations may be skewed to the upside as they are founded on benign projections of asset quality. Profitability is projected to decline in most countries going forward. At the same time, ROE is expected to improve in some countries, especially those with a higher share of fixed-rate lending where loan repricing takes place more gradually and which have already seen a larger pass-through of rate hikes to depositors (Chart 3.3, panel b).
Chart 3.3
Profitability projections for the next two years are below those for 2023, reflecting headwinds related to asset quality concerns, muted lending and rising funding costs
|
a) Change in ROE projections for euro area banks |
b) ROE projections for euro area banks across countries |
|---|---|
|
(1 Jan.-14 Nov. 2023, percentages) |
(14 Nov. 2023, percentages) |
 |
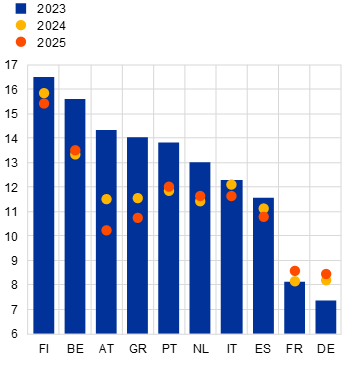 |
Sources: LSEG and ECB calculations.
Note: Based on market analyst projections of ROE for a sample of 29 listed euro area banks.
3.2 Early signs of asset quality deterioration from historical lows
The asset quality of euro area banks remains robust, but default rates and payment arrears are showing early signs of stress. Banks’ aggregate non-performing loan (NPL) ratio, a lagging indicator of asset quality, remained close to historical lows in the second quarter of 2023, while the Stage 2 ratio has declined slightly from recent elevated levels (Chart 3.4, panel a, left graph). At the same time, default rates on both corporate and retail exposures have started to increase (Chart 3.4, panel a, right graph), and the share of loans which are less than 90 days past due but still performing has also picked up and stands above the historically low levels seen in 2022. This increase may translate into more NPLs in the coming quarters, as new NPL formation typically lags any rise in early payment arrears (Chart 3.4, panel b).
Chart 3.4
NPL ratio remains stable, while default rates and payment arrears increase from low levels
|
a) NPL and Stage 2 ratios for total loans; euro area default rates on corporate and retail exposures |
b) Share of NFC loans that are less than one year past due |
|---|---|
|
(left graph: Q1 2018-Q2 2023, percentages; |
(Q1 2019-Q2 2023, percentages) |
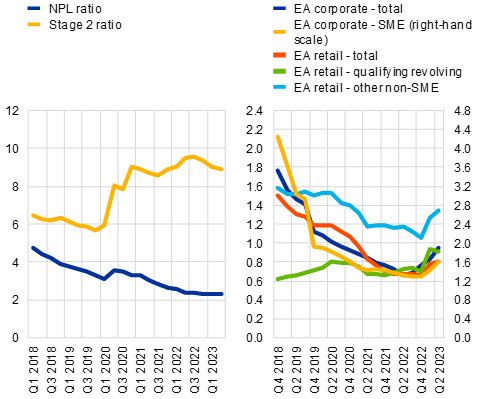 |
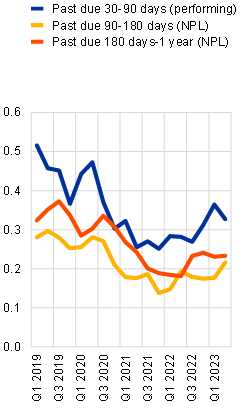 |
Source: ECB (supervisory data).
Notes: Panel a, left graph: based on a balanced sample of 81 euro area significant institutions; right graph: IRB-reporting significant institutions. Four-quarter trailing figures. Euro area exposures only. Panel b: full sample of significant institutions.
After a long period of improving asset quality, early signs of strain are now evident across loan portfolios. A breakdown by firm size reveals some divergence in asset quality as NPL ratios on loans to smaller firms[31] increased over the last two quarters, while NPL ratios decreased slightly on loans to firms with relatively higher total assets (top 5% of firms by total assets) (Chart 3.5, panel a, left graph). This development is in line with the typically stronger sensitivity of small firms to economic activity. Gross NPL inflows for loans to the commercial real estate (CRE) sector[32],[33] increased more in the second quarter of 2023 than offsetting NPL outflows (Chart 3.5, panel a, right graph). Given the recent substantial increase in interest rates, mortgages in countries with high shares of variable rates were more likely to become non-performing (Chart 3.5, panel b, left graph). Similarly, consumer loans saw their first couple of quarters of net NPL inflows after a long period of outflows (Chart 3.5, panel b, right graph). Countries with predominantly variable rates would be likely to see a more pronounced deterioration in asset quality going forward if the labour market were to weaken notably, adding to the squeeze on households due to rising mortgage debt service costs and a higher cost of living (Special Feature B).
Chart 3.5
Recent increase in mortgage NPL ratios predominantly in variable-rate countries; slight rise in CRE and consumer loans with recent NPL net inflows and NPL ratio of smaller firms up slightly
|
a) NPL ratio, by firm size; quarterly NPL flows for CRE loans |
b) Share of variable-rate mortgage lending and change in mortgage NPL ratios across euro area countries; quarterly NPL flows for consumer loans |
|---|---|
|
(left graph: Q1 2022-Q2 2023, exposure-weighted NPL ratio for NFC loans, percentages; right graph: Q3 2020-Q2 2023, |
(left graph: x-axis: 2009-23 mean, percentages; y-axis: difference between Q1 2023 and Q2 2023, percentage points; right graph: |
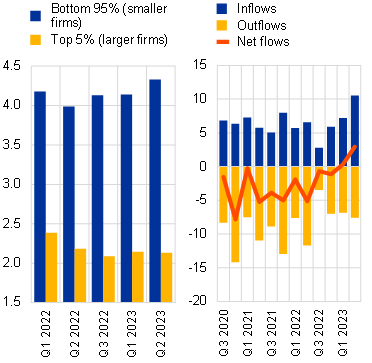 |
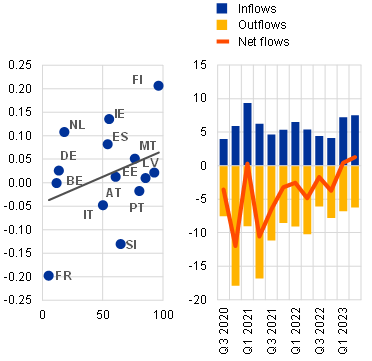 |
Sources: ECB (AnaCredit, MIR, RIAD, supervisory data), BvD Electronic Publishing GmbH – a Moody’s Analytics company and ECB calculations.
Notes: Panel a, left graph: only significant institutions supervised by the ECB. Total assets are taken from Orbis as at December 2021. The top 5% firms in terms of total assets are responsible for, on average, 75% of the outstanding amount of loans. Panels a and b, right graphs: full sample of significant institutions. Excludes loans held for sale. Panel b, left graph: the mean from 2009 to 2022 serves as a proxy for the share of variable-rate mortgages in the outstanding stock of loans in a given country. Fixed-rate mortgages are defined as new mortgages with fixed rates and maturities of more than one year/all new mortgages at a monthly frequency. The change in the mortgage NPL ratio is aggregated at the lender country level and covers the full sample of significant institutions. The data for Greece, Cyprus and Luxembourg are not shown in the graph due to the relatively large absolute changes in their respective mortgage NPL ratios. Their addition would not materially change the relationship shown when accounting for the size of the respective mortgage loan portfolios. Some national authorities have country-specific data on fixation periods of the stocks, but differences between the national data and the approximation based on flows are not substantial in most cases. Some differences can be seen, however, for Italy.
Banks may face higher provisioning needs, reflecting the vulnerability of borrowers to higher interest rates. The NPL coverage ratios of most loan portfolios have fallen compared with longer-term averages, in particular for consumer loans (Chart 3.6, panel a). The decline for collateralised loans may be explained at least in part by the fact that asset prices still stand above pre-pandemic levels, but with real estate collateral becoming increasingly illiquid and property prices falling, there is a risk that banks may be slow in adjusting their expected recoveries to reality, thereby potentially understating provisions. Banks recently increased provisions on loans to firms with lower interest coverage ratios (ICRs), meaning they are less able to repay their debt out of their recurring cash flows (Chart 3.6, panel b). This stands in contrast with the slight decline in provisions for high-ICR firms while remaining consistent with the notion that banks are anticipating stress for firms which are especially vulnerable to the recent rise in interest rates. The flipside of this is higher bank profitability for the time being. Nonetheless, a longer period of high interest rates is likely to lead to higher provisions, which in turn will be a drag on profitability further down the line. On the one hand, the difference in provisioning is reassuring because banks appear to be aware of the risk. On the other hand, it shows their exposure to this risk.
Chart 3.6
NPL coverage ratios remain below long-term averages, and banks are provisioning more for firms vulnerable to interest rate increases (low ICR)
|
a) NPL coverage ratios |
b) Provisioning, by ICR |
|---|---|
|
(Q2 2023, 2014-22 average; percentages) |
(Q1 2022-Q1 2023, percentages) |
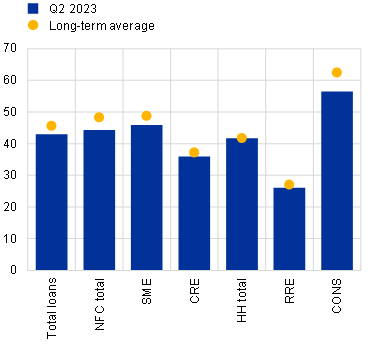 |
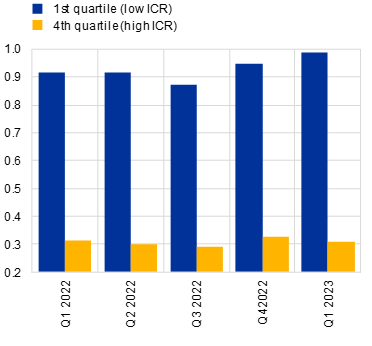 |
Source: ECB (supervisory data).
Notes: Full sample of significant institutions. Panel a: CONS stands for consumer loans. Panel b: provisions as a share of exposures for all non-defaulted NFC loans.
Lending dynamics have weakened substantially, which will weigh on bank profitability going forward. The monetary policy tightening that started last year prompted banks to tighten their credit standards to historically elevated levels. In addition, higher interest rates, coupled with a more uncertain economic outlook, have contributed to a substantial decline in loan demand (Chart 3.7, panel a). As a consequence, cumulative year-to-date net lending flows to the non-financial private sector have been stagnant, in stark contrast with the loan book expansion seen over the previous seven years (Chart 3.7, panel b). While banks’ lending margins have expanded on the back of higher rates, the muted lending dynamics represent a headwind for bank profitability going forward.
Chart 3.7
Credit standards have tightened and loan demand has declined to historical lows, while year-to-date lending flows are the lowest since 2015
|
a) Credit standards and loan demand for lending to NFCs and household mortgages |
b) Year-to-date flows of lending to NFCs and households |
|---|---|
|
(Q1 2003-Q3 2023, net percentages) |
(2003-23, € billions) |
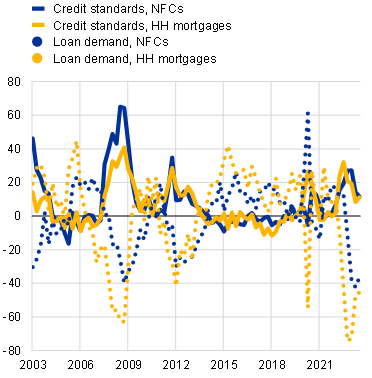 |
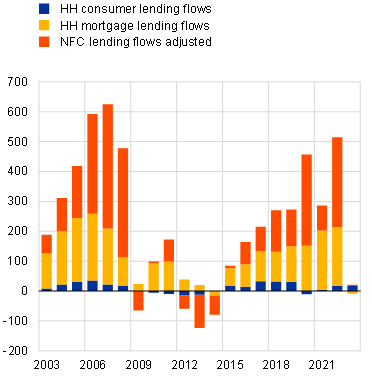 |
Sources: ECB (BLS, BSI) and ECB calculations.
Notes: Panel a: for credit standards, net percentages are defined as the difference between the sum of the shares of banks responding “tightened considerably” and “tightened somewhat” and the sum of the percentages of banks responding “eased somewhat” and “eased considerably” in the ECB’s bank lending survey. Net percentages for the questions on demand for loans are defined as the difference between the sum of the shares of banks responding “increased considerably” and “increased somewhat” and the sum of the shares of banks responding “decreased somewhat” and “decreased considerably”.
3.3 Rising funding costs as bonds reprice and deposit betas adjust
The pass-through of policy rates to depositors by euro area banks remains limited for overnight deposits, leading to a shift towards term deposits. The pass-through of policy rates to bank depositors has not substantially changed since the publication of the previous Financial Stability Review and remains sizeable only for term deposits (Chart 3.8, panel a, left graph). After years of low rates, banks’ deposit books have been skewed towards overnight deposits. But while overnight deposits are constantly repriced at the prevailing rates, banks have been reluctant to increase these overnight rates more substantially. At 0.3% and 0.7% respectively, interest rates on overnight deposits from households and from NFCs, which account for the largest share of outstanding deposit volumes in both segments, correspond only to a pass-through rate of 7% and 18% of the change in policy rates since summer last year. These deposit betas are low compared with past hiking cycles, making it likely that a more substantial rise in deposit rates will weigh on interest margins, and hence bank profitability, going forward. There is a substantial dispersion of deposit betas across not only different types of deposit and counterparty but also euro area countries, which is to some extent driven by regulation as well as by competition among banks (Chart 3.8, panel a, right graph). The differences in remuneration between deposit types has led to a gradual shift from overnight to term deposits since the start of the hiking cycle, in line with historical regularities, and funds have remained largely within the banking sector (Chart 3.8, panel b). The fact that deposit outflows have been higher than inflows into money market funds in absolute terms could be related to higher consumption and working capital costs in a context of higher inflation. Concerns about deposit outflows have also been mentioned in the discussions surrounding the introduction of a digital euro. Specific design features such as a cap on individual holdings would prevent such unintended consequences (Box 4).
Chart 3.8
Depositors are slowly shifting from overnight accounts to better-remunerated term deposits
|
a) Change in aggregate deposit rates since start of tightening cycle; deposit betas across euro area countries |
b) Cumulative flows of bank deposits, money market funds and bonds |
|---|---|
|
(left graph: Jan. 2022-Nov. 2023, percentages; |
(Sep. 2022-Sep. 2023, € billions) |
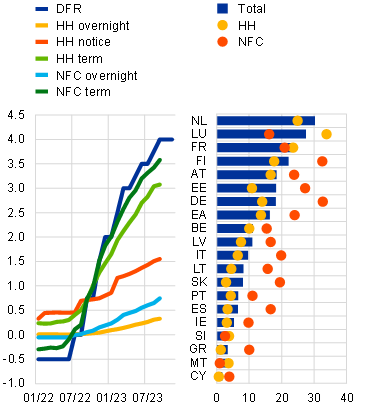 |
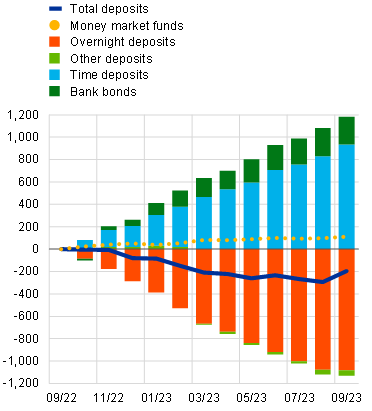 |
Sources: ECB (BSI, MIR) and ECB calculations.
Notes: Panel a: deposit betas capture the percentage pass-through of the increase in the ECB’s deposit facility rate (DFR) to new business deposit rates since the start of the hiking cycle in July 2022. All three deposit types – overnight, notice and term deposits – are taken into account in the right graph. Panel b: bank deposits consist of deposits placed with the monetary financial institution (MFI) sector by euro area residents excluding MFIs, central governments and financial vehicle corporations involved in securitisation activity. Their flows have been adjusted for the operational incident in TARGET2, which inflated the September 2022 other financial institutions deposits before then being reversed in October and November 2022. Bank bonds are those held by euro area residents excluding MFIs and central governments.
Bond issuance volumes have been very strong this year, in particular for senior instruments, despite elevated funding costs. The yields on euro area bank bonds have stabilised at elevated levels since late spring (Chart 3.9, panel a). As a sizeable share of bank bonds matures over the next few years, the large increase in bond yields since the end of 2021 will continue to translate into higher bond funding costs for banks. A repricing of maturing bonds at current secondary market yields would cause banks’ bond funding costs to rise to 2.1% at the end of 2023 and 2.4% at the end of 2025. Apart from March, when bond issuance stalled due to the tensions in the Swiss and US banking sectors, 2023 has seen issuance volumes well above the range observed prior to the pandemic (Chart 3.9, panel b, left graph). At €432 billion, year-to-date issuance volumes are around 37% above the average observed between 2017 and 2019. Issuance of covered and senior unsecured bonds has been particularly strong in 2023, while that of senior bail-inable bonds has remained below pre-pandemic averages (Chart 3.9, panel b, right graph). The market for Additional Tier 1 securities has reopened gradually as spreads narrowed from the levels observed immediately after the March tensions. Banks have also shortened bond maturities quite substantially in response to higher interest rates. While the aggregate maturity of outstanding senior bonds for euro area banks is around ten years, senior bonds issued in 2023 only have an average maturity of around six years.
Chart 3.9
Bond yields have remained broadly unchanged at elevated levels, while issuance activity is strong, especially for covered and senior unsecured instruments
|
a) Bond yields of euro area banks across seniorities and average bond funding costs |
b) Monthly and year-to-date bond issuance volumes of euro area banks |
|---|---|
|
(Q4 2021-2025E, annual percentages) |
(€ billions) |
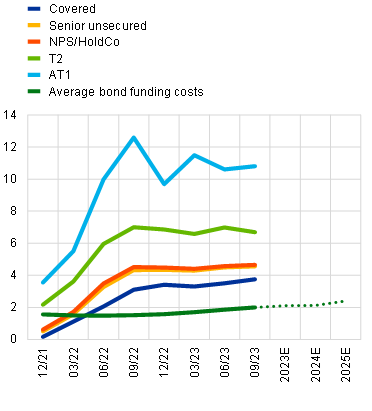 |
|
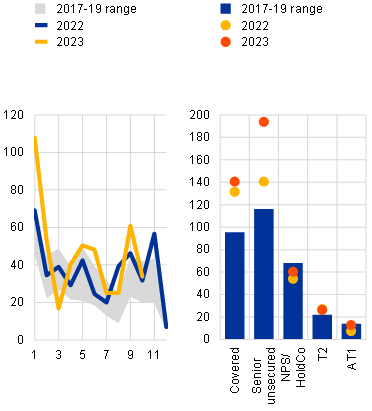
Sources: S&P Dow Jones Indices LLC and/or its affiliates, Dealogic and ECB calculations.
Notes: Panel a: the funding cost scenario (indicated by the dotted line) assumes that maturing bonds are refinanced at a yield to maturity observed in the secondary market in September. All funding costs are volume weighted (covered, senior unsecured, NPS/HoldCo and T2 bonds are included, being the main seniorities maturing in 2023). AT1 stands for Additional Tier 1 securities; T2 stands for Tier 2 securities; NPS/HoldCo stands for senior non-preferred securities.
Liquidity buffers remain well above regulatory requirements, despite declining upon repayment of central bank funding. Aggregate liquidity ratios of euro area banks continued their expected decline in line with the gradual repayment of the targeted longer-term refinancing operations (TLTRO) and the associated, albeit smaller, reduction in central bank reserves. Central bank reserves were also affected by autonomous factors, with a significant amount of non-monetary policy deposits moving away from the Eurosystem into the market. The aggregate liquidity coverage ratio (LCR) fell from a peak of 174% in the second quarter of 2021 to 157% in the second quarter of 2023, while the net stable funding ratio (NSFR) – which captures the medium-term resilience of bank funding – has increased slightly during the past six months to 125% (Chart 3.10, panel a). In terms of the breakdown of high-quality liquid assets, the share of central bank reserves has declined alongside TLTRO repayments but remains the largest single element, at around two-thirds of the total. The aggregate picture masks substantial differences at the individual bank level. While the vast majority of significant institutions have liquidity ratios well above their regulatory requirements, there are some banks with LCR and NSFR levels that indicate lower resilience to funding stress. Large banks tend to operate with smaller liquidity buffers, which is evident from the fact that the 25th percentile for both liquidity ratios is close to the euro area aggregate (Chart 3.10, panel b).
Chart 3.10
Despite gradual TLTRO repayments, liquidity ratios are substantially above regulatory thresholds overall, but some banks have smaller liquidity buffers
|
a) High-quality liquid assets and liquidity ratios; cumulative changes in TLTROs of euro area banks |
b) Dispersion of liquidity ratios across euro area banks |
|---|---|
|
(left graph: Q1 2017-Q2 2023, € trillions, percentages; |
(Q2 2021, Q2 2023, percentages) |
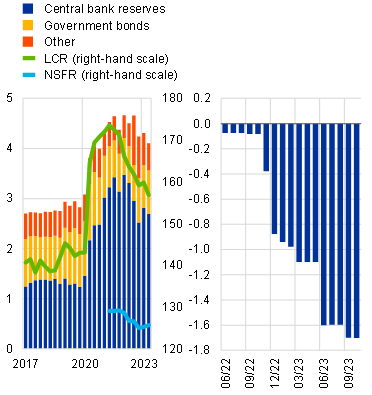 |
 |
Sources: ECB (supervisory data, ILM) and ECB calculations.
Notes: Based on a balanced sample of 81 euro area significant institutions. Panel b: the dashed and the dotted yellow lines represent the median and the 25th percentile for the cross-sectional distribution of the LCR and NSFR in Q2 2023 respectively.
Box 4
A digital euro: gauging the financial stability implications
Central banks around the world have stepped up their efforts to explore and develop their own digital currencies (known as CBDCs),[34] an electronic equivalent to cash. New technologies in retail payments (e.g. mobile payments, digital wallets and the potential future deployment of crypto-asset payments) and changes in people’s payment habits have fuelled the interest of central banks in CBDCs. In the euro area, for example, the share of transactions for which cash was used as a means of payment declined from 79% to 59% between 2016 and 2022. At the same time, the coronavirus (COVID-19) pandemic, among other things, has accelerated the shift towards online shopping and digital payments (Chart A, panel a). In response, central banks are investigating the benefits and risks of CBDCs in complementing banknotes and coins, offering an additional means of payment in an increasingly digitalised economy (Chart A, panel b).
3.4 Improved solvency and rising capital distributions
Solvency ratios have risen in 2023, supported by higher bank profitability and bank de-risking, with increased appetite for capital distributions. After declining in 2022, the aggregate Common Equity Tier 1 (CET1) ratio of euro area banks rose in the first half of 2023 to 15.3%, which is well above the aggregate maximum distributable amount (MDA) trigger of 11.1% (Chart 3.11, panel a). The increase of around 30 basis points was driven mainly by higher retained earnings on the back of improved bank profitability and declining average risk weights, reflecting a de-risking of banks’ portfolios. At the same time, rising total assets in the first quarter made a negative contribution (Chart 3.11, panel b, left graph).[35] The results of the European Banking Authority (EBA) stress test[36], which were published at the end of July, show that euro area banks remain resilient overall, even under an adverse scenario which combines a severe EU and global recession, rising interest rates and higher credit spreads (Chart 3.11, panel a). The substantial recent improvement in bank profitability, the associated rise in banks’ management buffers and the high cost of equity have increased the appetite for capital distributions, which have been rising over the last two years (Chart 3.11, panel b, right graph).
Chart 3.11
Solvency of euro area banks has risen on the back of stronger profits, leading to an increasing appetite for capital distributions in the form of dividends and share buybacks
|
a) Change in actual CET1 ratios and EBA 2023 stress test results for euro area banks |
b) Decomposition of changes in euro area banks’ CET1 ratio and capital distributions |
|---|---|
|
(Q1 2018-26E, percentages) |
(left graph: H1 2023, percentages; right graph: 2017-23, percentages of total assets, percentages) |
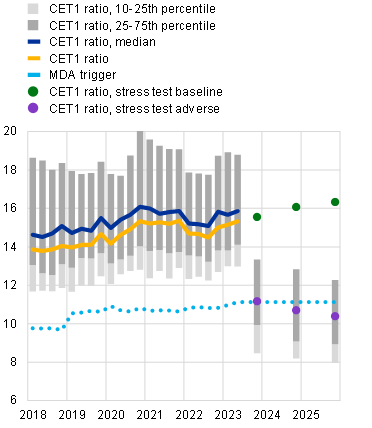 |
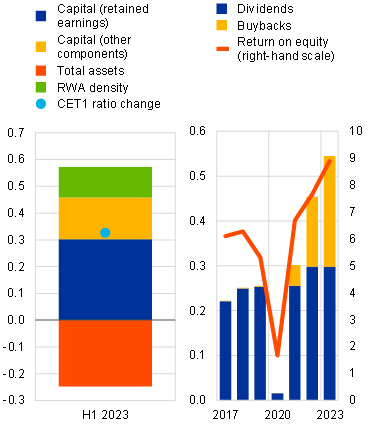 |
Sources: Bloomberg Finance L.P., ECB (supervisory data) and ECB calculations.
Notes: Panel a: based on a balanced sample of 81 euro area significant institutions. Panel b: the left graph is based on a balanced sample of 81 euro area significant institutions. The right graph is based on a balanced sample of 47 listed euro area banks. Information on dividends and share buybacks represent the payments as announced in each of the years. The year of announcement is usually also the year in which payments are made. Amounts represent the annual value of dividend payments and share buybacks scaled by the average total assets of all banks in the sample over the sample period. ROE for 2023 is a projection by market analysts.
Global cyberattacks targeting financial institutions have continued to rise in 2023. After reaching a new peak in 2022, the number of global cyberattacks detected across all economic sectors in the first five months of 2023 was broadly the same as last year. The number of attacks recorded in the financial sector globally this year is, however, about 30% higher than a year ago, highlighting just how serious the threat is. Accordingly, financial institutions need to ensure that they have in place an adequate level of cyber resilience for their own protection as well as for that of the entire financial ecosystem.
While market valuations of euro area banks have not recovered fully since the March turmoil, they have been outperforming the broader market in the year to date on the back of higher interest rates. Compared with their peers in other regions, notably Switzerland and the United States, euro area banks have seen their equity prices perform well this year (Chart 3.12, panel a, left graph). Euro area bank equities have gained 16% since the banking turmoil in March and are up 15% in the year to date. This is slightly above the broader market trend, driven partly by better than expected earnings results. The performance of bank stocks relative to the market continues to be driven strongly by interest rate expectations, as banks are perceived to be one of the main beneficiaries of policy rates remaining higher for longer (Chart 3.12, panel a, right graph). The rate sensitivity of their profitability is also reflected in bank stock prices performing differently across country lines, with outperformance evident in countries with larger increases in NIMs (Chart 3.12, panel b).
Chart 3.12
Bank stock prices have recovered since the March turmoil and the outperformance of the banking sector and across countries is being driven by rate sensitivity
|
a) Bank stock price performance across global regions; bank stock price performance relative to the broader market |
b) Change in NIM and bank stock price performance at the country level relative to euro area aggregate |
|---|---|
|
(left graph: 2 Jan.-14 Nov. 2023, percentages; right graph: |
(July 2022-Nov. 2023, percentage points, percentages) |
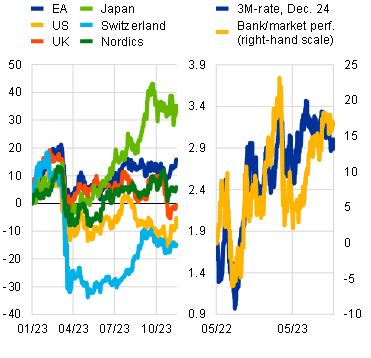 |
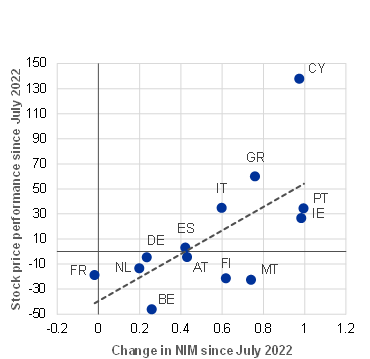 |
Sources: Bloomberg Finance L.P., ECB and ECB calculations.
Notes: Panel a: the sample consists of 71 global listed banks. Share prices across regions are weighted by banks’ total assets.
The difference between banks’ cost of equity (COE) and their ROE has not narrowed, with different factors at play, notably macroeconomic uncertainty and cost-inefficiencies. Indeed, the COE, an estimate of market participants’ compensation for investing into banks’ equity, rose alongside the ROE, as higher interest rates more than offset a narrowing in the equity risk premium. Since cross-sectional differences in the COE can be partly attributed to bank fundamentals, lingering structural issues like cost-inefficiencies might explain why bank valuations have not picked up, as investors might have doubts about the sustainability of the recent rise in bank profitability (Box 5).
Box 5
Euro area bank fundamentals, valuations and cost of equity
Euro area bank earnings have reached multi-year highs, while bank equity valuations have not substantially exceeded pre-pandemic levels. Between March 2022 and the end of the year, the share prices of euro area banks increased by 18% from the lows they reached after the start of Russia’s unjustified war against Ukraine, as earnings expectations recovered from the initial shock. The negative impact of higher risk-free rates on the net present value of future dividends paid by banks was broadly offset by reduced uncertainty about the prospects of the sector, as measured by the equity risk premium (Chart A, panel a). However, the equity risk premium widened abruptly in March 2023 during the banking tensions in the United States and Switzerland and continued to widen even when the tensions had abated. Taken together with increasing bank profitability, this pattern indicates increased uncertainty about the long-run sustainability of bank earnings. Bank equity risk premia have continued to weigh on valuations since the spring tensions. The aim of this box is to shed light on the cost of equity (COE) and market valuations in the banking sector and to reach a better understanding of the role of bank fundamentals in this context.[37]
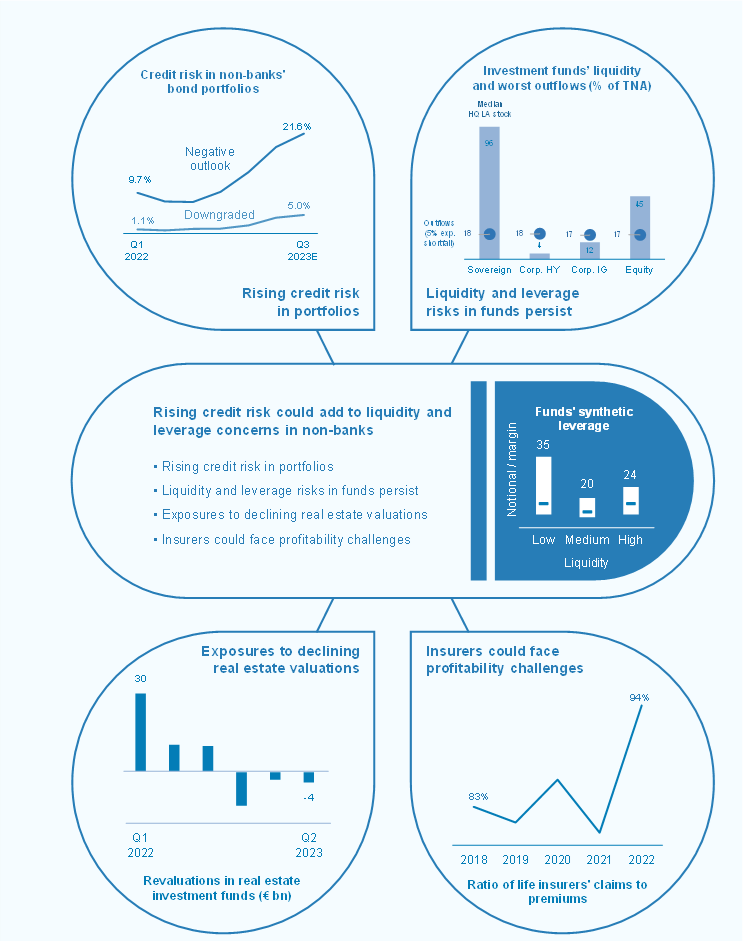
4.1 Non-banks have proved resilient recently but may face challenges ahead as structural vulnerabilities persist
Investment activity in the non-bank financial intermediation (NBFI) sector has picked up again in 2023, supporting debt issuance by sovereigns and corporates. Despite the uncertain macroeconomic environment (Chapter 1) and challenging financial market conditions (Chapter 2), investment funds (IFs) and insurance corporations and pension funds (ICPFs) have proved resilient recently and remain very active in primary debt markets. The sector continued to rebalance its investment portfolios towards comparatively safer assets in the first half of 2023. The total value of bond portfolios, which was significantly affected by revaluation losses in 2022, has increased once again. This has been driven by rising active (re)investment in mostly higher-rated debt securities (Chart 4.1, panel a). As of mid-2023, cumulative purchases in the highest-rated bonds over one year have been close to the record levels seen during the post-pandemic recovery (Chart 4.1, panel b). The NBFI sector has also increased its investments in bank bonds, although demand for bank equities has remained muted since the banking sector turmoil in March of this year (Chart 4.1, panel c). Overall, this highlights the sector’s ongoing important role in financing banks (Chapter 3), non-financial corporations and sovereigns (Box 1).
Chart 4.1
The NBFI sector has continued to rebalance portfolios, including by further increasing its purchases of bank debt and higher-rated bonds in primary debt markets
|
a) Drivers of changes in euro area NBFI sector bond portfolios, by credit rating |
b) Euro area NBFI sector purchases of newly issued bonds, by credit rating |
c) Euro area NBFI sector net purchases of debt and equities issued by euro area banks |
|---|---|---|
|
(Q1 2020-Q2 2023; left-hand scale: € trillions; right-hand scale: percentages) |
(Q1 2019-Q2 2023, € billions) |
(Q1 2022-Q2 2023, € billions) |
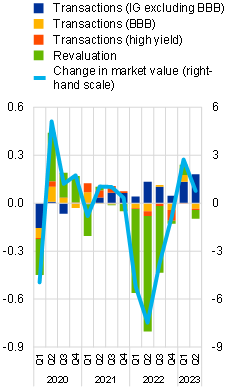 |
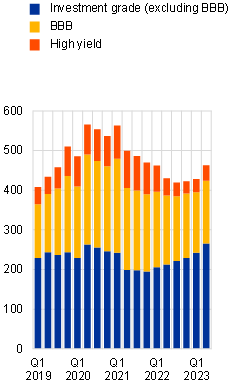 |
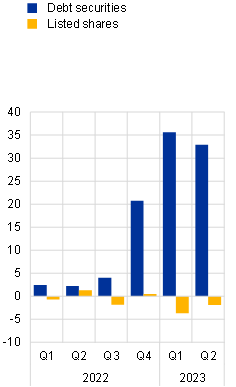 |
Sources: ECB (SHS, CSDB), S&P Global Market Intelligence, Moody’s Analytics, Fitch Ratings, DBSR Morningstar and ECB calculations.
Notes: All amounts at market value. Panel a: IG stands for investment grade. Panel b: purchases of long-term bonds issued in the same quarter, accumulated over the past four quarters to account for seasonality.
Against a backdrop of macroeconomic uncertainty and tighter financial conditions, the NBFI sector remains vulnerable to rising credit risks. Over the past year, NBFI sector bond portfolios have seen an increase in rating downgrades, with amounts rising above pre-pandemic levels (Chart 4.2, panel a). Downgrades in this context have mostly been concentrated among higher-rated issuers. At the same time, the credit outlook has deteriorated for several issuers, given the continuing high level of macroeconomic uncertainty, persistent inflation and tighter financial conditions. As a result, and despite rebalancing towards comparatively safer assets, the NBFI sector is now exposed to higher levels of holdings that have been given a negative credit outlook – these could be downgraded in the near future, implying possible revaluation losses (Chart 4.2, panel b). The increase in holdings at risk of rating downgrades has been concentrated primarily among sovereign issuers. This reflects both the forthcoming substantial refinancing needs of several governments (Chapter 1, Box 1) and the high share of sovereign bonds in non-banks’ portfolios. Rising credit risk may cause losses for riskier IFs and weigh on ICPF profitability, increasing the risk of redemptions and policy lapses[38] respectively, while also reducing the financial intermediation capacity of the NBFI sector (Sections 4.2 and 4.3).
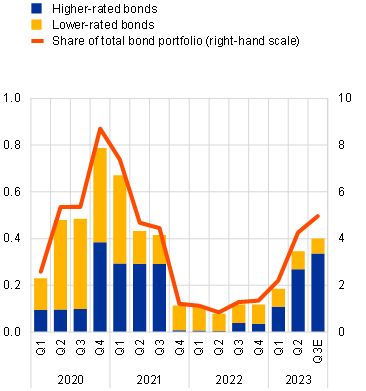
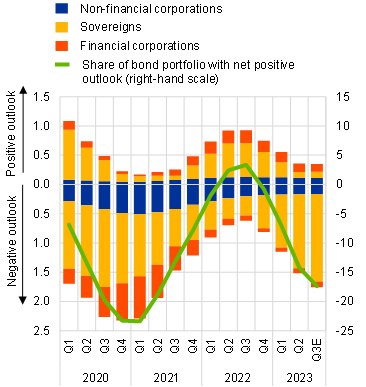
A deterioration in the macroeconomic outlook or wider adverse shocks could trigger sudden liquidity needs in the NBFI sector. Given that liquidity buffers in the NBFI sector remain very low, sudden investment fund outflows, large margin calls or lapsing insurance policies could lead to forced asset sales, which would amplify downward pressures in financial markets. Pursuing policies aimed at strengthening the liquidity and liquidity preparedness of the NBFI sector from a macroprudential perspective therefore remains of great importance in safeguarding financial stability across the sector and the wider financial system (Chapter 5, Box 6).
4.2 Risks related to liquidity and leverage point to structural vulnerabilities in investment funds
Euro area investment funds continue to shift their bond portfolios towards higher-rated debt, but the uncertain macroeconomic outlook could trigger renewed revaluation losses. Compared with 2022, investments in the first two quarters of 2023 were more strongly focused on purchases of investment-grade sovereign and corporate bonds, while sales of high-yield debt securities ceased (Chart 4.3, panel a). However, investment-grade sovereign bonds were particularly sensitive to revaluation losses during 2022 (Chart 4.3, panel b). While more limited in 2023 to date, losses could potentially be triggered by the uncertain macroeconomic outlook (Overview, Chart 5, panel b).
Fund flows mirror the shift observed in funds’ debt securities portfolios. Inflows into euro area-domiciled sovereign and investment-grade corporate bond funds are increasing, as safe assets are performing well in the current environment. This aligns with the shift observed in the fund sector’s bond portfolios. At the same time, there have been significant net outflows from equity funds invested in the financial sector since the episode of banking stress in March of this year (Chart 4.4, panel b).
Chart 4.3
Investment funds continue to shift to safer bonds, mitigating financial stability concerns, but revaluations of their debt securities portfolios might still pose challenges
|
a) Euro area investment funds’ debt securities transactions, by rating and issuer sector |
b) Revaluations of euro area investment funds’ debt securities portfolios, by rating and issuer sector |
|---|---|
|
(Q1 2021-Q2 2023, € billions) |
(Q1 2021-Q2 2023, percentages of total market value) |
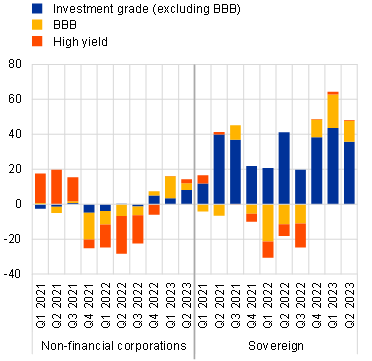 |
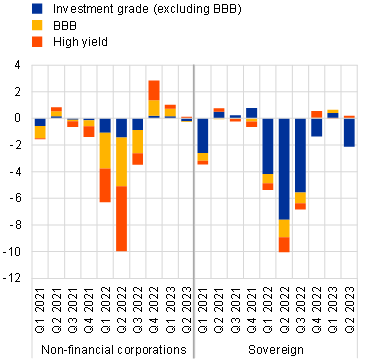 |
Sources: ECB (CSDB, SHS), S&P Global Market Intelligence, Moody’s Analytics, Fitch Ratings, DBSR Morningstar and ECB calculations.
Note: The analysis excludes unrated bond holdings.
Decreasing net inflows into real estate investment funds (REIFs) might amplify negative effects on the real estate cycle. In recent quarters, REIFs have experienced decreasing net inflows – and even net outflows in some jurisdictions – and revaluation losses (Chart 4.4, panel a) in a context of monetary policy tightening, a turning real estate cycle and higher bond yields, all of which have contributed to making these funds less attractive for investors. Given the importance of REIFs for the real estate market, instability in this segment is especially concerning as it could amplify risks to the real estate sector.[39]
Financial stability concerns about stress in the Chinese real estate market spilling over to the euro area investment fund sector are currently limited. Net inflows into funds investing in Chinese equities began to slowly decrease at the start of the year, before turning into outflows as of the end of August 2023 (Chart 4.4, panel b). This dynamic reflects the real estate stress affecting the Chinese economy (Chapter 2). That said, in September 2023 China-focused investment funds accounted for less than 1% of the total net asset value of euro area-domiciled equity funds.[40] The limited and decreasing relevance of such funds is mitigating financial stability concerns about direct spillovers from Chinese market stress to the euro area investment fund sector. At the same time, a slowdown in China might have repercussions for the investment fund sector through its macroeconomic effects on the euro area economy or via adverse sentiment effects in financial markets.
Chart 4.4
Fund flows reflect the current macroeconomic environment
|
a) Inflows and revaluations in real estate funds in the euro area |
b) Cumulative flows into euro area-domiciled bond and equity funds, by type |
|---|---|
|
(Q1 2020-Q2 2023, € billions) |
(2 Jan.-14 Nov. 2023, percentages of net asset value) |
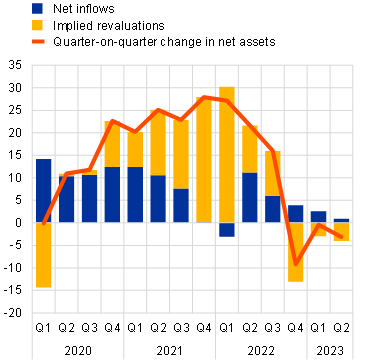 |
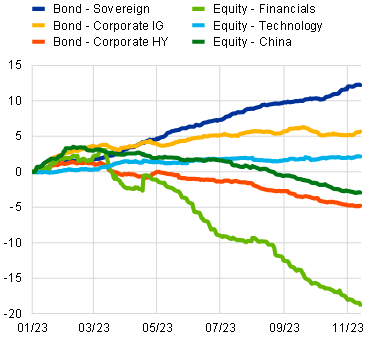 |
Sources: ECB (IVF), EPFR Global and ECB calculations.
Notes: Panel a: implied revaluations are calculated as the difference between the quarter-on-quarter change in net asset value minus net inflows. Panel b: IG stands for investment grade; HY stands for high yield.
Despite the ongoing de-risking process, the euro area investment fund sector remains vulnerable to liquidity risks. Cash buffers in equity and bond funds remain low in a context of tightening financial conditions, although they proved to be adequate for the level of aggregate net outflows that these funds experienced during relatively volatile market conditions in 2022 (Chart 4.5, panel a). Aggregate statistics do not, however, sufficiently capture liquidity risk or how associated structural vulnerabilities have evolved. These dimensions can be better assessed by looking at fund-level data and their distribution. Focusing on open-ended bond funds, their liquidity resilience to severe redemptions appears to have deteriorated compared with before the pandemic (Box 6, Chart B, panel a). In an adverse scenario, inadequate liquidity buffers could lead investment funds to engage in procyclical selling behaviour, potentially amplifying market corrections.
Structural vulnerabilities in euro area investment funds may also be caused by leverage. This could be financial leverage through unsecured and secured borrowing, such as via repurchase agreements (repos) and other securities financing transactions, or synthetic leverage through derivative exposures. Excessive leverage can amplify stress and propagate shocks from the investment fund sector to the wider financial system, potentially leading to systemic issues. The distribution of investment funds’ financial leverage from repo borrowing[41] shows that this type of leverage is low on average, but pockets of highly leveraged funds could be a source of financial stability concerns (Chart 4.5, panel b). The distribution of synthetic leverage tells a different story, however. One way to measure the leverage embedded in derivatives portfolios is by calculating the ratio of the portfolio’s gross notional value (GNV) to the initial margin (IM) posted.[42] The data collected from a sample of investment funds’ equity derivatives portfolios show that the synthetic leverage stemming from these positions can be significant (Chart 4.5, panel c).[43]
The combination of leverage, low liquidity buffers and high credit risk is a significant financial stability concern which underscores the need to strengthen the resilience of investment funds from a macroprudential perspective. As (synthetic) leverage can amplify shocks, especially when combined with liquidity and credit risk, it is important to consider these three aspects together.[44] Some of the funds with low liquidity buffers and risky asset portfolios might also be exposed to derivatives portfolios with a high level of synthetic leverage embedded,[45] making them especially vulnerable (Chart 4.5, panel c). Together with the other vulnerabilities discussed in this section, these risks highlight the need to strengthen the resilience of the investment fund sector from a macroprudential perspective (Chapter 5).
Chart 4.5
The euro area investment fund sector is vulnerable to risks from leverage and low liquidity buffers
|
a) Cash buffers and recent fund flows as a share of total net assets |
b) Distribution of investment funds’ financial leverage from repo borrowing |
c) Distribution of investment funds’ synthetic leverage in equity derivatives portfolios, by quintiles of HQLA and cash holdings, and credit risk level of their portfolios |
|---|---|---|
|
(Q1 2021-Q2 2023, percentages) |
(Q2 2023, repo borrowing/net asset value) |
(30 Jun. 2023, GNV/IM posted) |
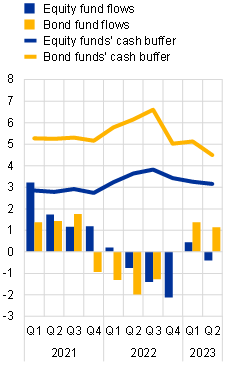 |
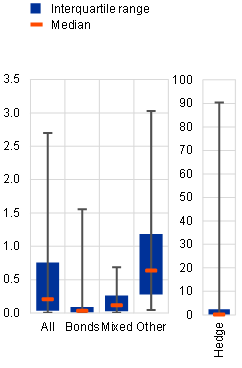 |
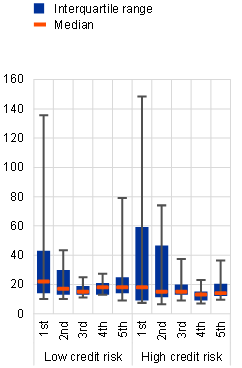 |
Sources: ECB (IVF, EMIR, SFTDS), EMIR sector enrichment based on Lenoci and Letizia*, LSEG Lipper IM and ECB calculations.
Notes: Panel b: the leverage ratio is calculated as the median of the total repo borrowing during the quarter divided by the net asset value of the fund. Box plot whiskers represent the 5th and 95th percentiles of the distribution. Panel c: HQLA stands for high-quality liquid assets. The analysis only includes portfolios of centrally cleared equity derivatives. As at 30 June 2023, these portfolios accounted for 8% of the total centrally cleared derivative portfolio. The GNV/IM posted ratio is a measure of synthetic leverage at the portfolio level and as such does not capture the total synthetic leverage of an individual fund. For confidentiality reasons, box plot whiskers represent the 10th and 90th percentiles of the distribution where each observation consists of the aggregation of three funds. Liquidity buffers are expressed as the share of cash and HQLA in the total net assets of a fund. Part of these buffers might already be pledged as collateral for initial margins. The quintiles are ordered from lowest liquidity buffers to highest (i.e. the first quintile contains the lowest 20% of the liquidity buffer distribution). The credit risk of a fund is defined as the average credit risk of the fund’s portfolio. The credit risk score goes from 0 (lowest) to 10 (highest). The low credit risk sample includes all those funds whose portfolios have an average credit score below 3.
*) See Lenoci, F.D. and Letizia, E., “Classifying Counterparty Sector in EMIR Data”, in Consoli, S., Reforgiato Recupero, D. and Saisana, M. (eds.), Data Science for Economics and Finance, Springer, Cham, 2021.
4.3 Insurers remain resilient, but rising economic uncertainty could challenge profitability
Euro area insurers remain resilient overall, with strong profitability and solvency positions. Insurers continued to perform well in the first quarter of 2023. The aggregate profitability of large insurance groups – as measured by return on equity – continued to increase (Chart 4.6, panel a). Solvency Capital Requirement (SCR) ratios also remained well above the regulatory minimum of 100%, despite a recent decline (Chart 4.6, panel b).[46] Furthermore, a falling combined ratio (defined as claim-related losses plus expenses divided by net premiums earned) in the first quarter of 2023 points to improved underwriting profitability for large non-life insurers, following the negative impact of inflation in 2022 (Chart 4.6, panel c). Looking ahead, slower economic growth could pose profitability challenges for non-life (re)insurers, as this could result in falling demand for new policies or rising numbers of policy lapses.
Chart 4.6
Insurers’ profitability and solvency remain strong in aggregate
|
a) Return on common equity |
b) Solvency Capital Requirement ratio |
c) Combined ratio (non-life) |
|---|---|---|
|
(Q2 2021-Q1 2023, percentages) |
(Q2 2021-Q1 2023, percentages) |
(Q2 2021-Q1 2023, percentages) |
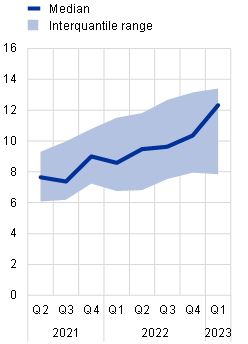 |
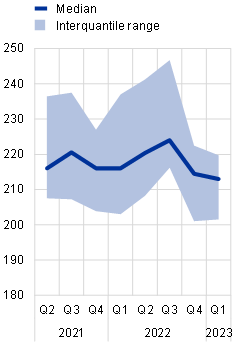 |
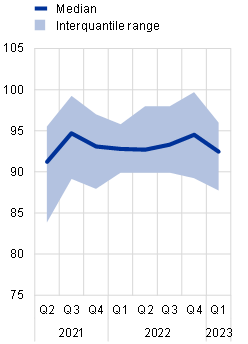 |
Sources: Bloomberg Finance L.P. and ECB calculations.
Notes: Data are based on a sample of large euro area insurers offering life and non-life products. The combined ratio is a common measure of non-life insurance profitability.
Life insurers may also face challenges from declining underwriting profitability. While aggregate profitability (i.e. profitability from both investment and underwriting activities) continues to increase for the insurance sector as a whole, life insurers faced declining underwriting profitability in 2022 (as measured by the ratio of claims incurred plus acquisition expenses to premiums written) (Chart 4.7, panel a). This was primarily driven by falling real household incomes, which reduced demand for new life insurance policies, while policy lapses also increased marginally (Chart 4.7, panel b). Profitability may remain a concern going forward, as slower growth could further weigh on demand for new policies and increase lapse rates. In addition, early redemptions of traditional savings products by policyholders may also pose a challenge for some life insurers, as higher interest rates could provide an incentive to reinvest in new contracts or alternative assets offering higher returns.
Chart 4.7
Euro area life insurers face challenges from falling profitability
|
a) Ratio of claims incurred and acquisition expenses to premiums written |
b) Lapse rates on life business of large euro area insurance groups |
|---|---|
|
(2018-22, percentages) |
(2018-22, percentages) |
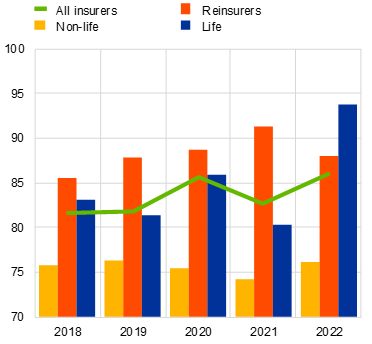 |
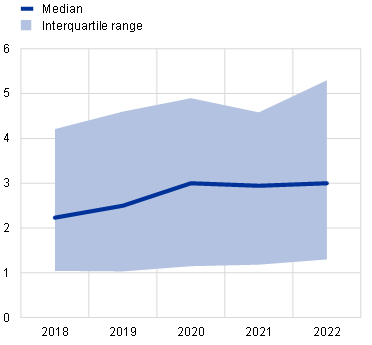 |
Sources: ECB (ICO, LIG) and ECB calculations.
Note: Panel a: the chart shows observations for Q4 of each year for all insurance groups.
Higher interest rates may increase the resilience of insurers and pension funds in the medium term, but it is important for them to strengthen their liquidity preparedness to meet margin calls. The recent gradual increase in interest rates is beneficial for insurance corporations and pension funds (ICPFs), given their negative duration gaps.[47] It has also contributed to greater demand for higher-quality bonds from ICPFs in recent quarters (Chart 4.8, panel a). This may help to lower credit risk for ICPFs, though some exposures to vulnerable corporates remain (Section 4.1). Similarly, higher yields can alleviate concerns regarding the absorption of future sovereign bond issuance (Box 1). At the same time, any sharp increase in sovereign bond yields or a spike in financial market volatility could expose those ICPFs which use interest rate derivatives to large margin calls. Recent stress events, such as the March 2020 market turmoil and the UK gilt market episode, demonstrate how liquidity pressures faced by ICPFs can propagate stress across the wider financial system. This underscores how important it is for ICPFs to strengthen their liquidity preparedness to meet margin calls (Chapter 5).
In the near term, higher interest rates may result in revaluation losses on exposures to assets and sectors, such as real estate, which are sensitive to interest rates. During the period of ultra-low interest rates that prevailed until last year, ICPFs significantly increased their holdings of less liquid assets, especially real estate. ICPFs generally have indirect exposure to real estate, mainly in the form of shares in euro area real estate investment funds (REIFs) (Chart 4.8, panel b). A decrease in incentives to search for yield could lead to a rebalancing of portfolios away from commercial real estate (CRE). Moreover, CRE prices have fallen recently as financial conditions have tightened (Chapter 1) and they remain at risk of further correction, which could result in losses for ICPFs. Price corrections could also increase redemption pressures for REIFs, which could potentially lead to forced sales (Section 4.2) and hence losses for their investors, including ICPFs. Equally, the potential for losses could incentivise ICPFs to rebalance their portfolios away from CRE, including by means of redemptions from REIFs. In turn, this could contribute to potential liquidity pressures for REIFs. The ongoing correction in CRE markets and financial system interconnectedness warrant continued monitoring.
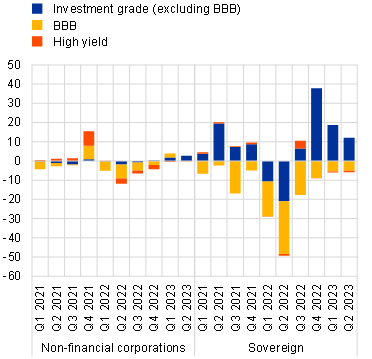
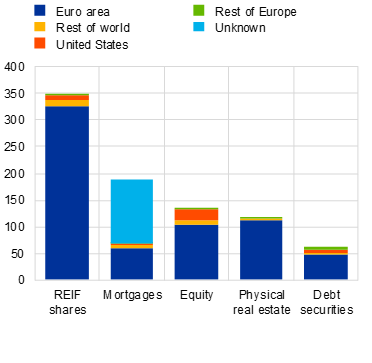
Over the longer term, insurers will continue to face several fundamental challenges, including climate change. Estimated global insured losses of USD 124 billion made 2022 one of the costliest years ever in terms of natural catastrophes.[48] In Europe, three series of events alone – droughts in France, Storms Dudley, Eunice and Franklin in February 2022, and Storms Petra and Qiara in June 2022 – generated direct economic losses of USD 17 billion and insured losses of USD 10 billon.[49] The rising frequency of major natural catastrophes due to climate change and the growing magnitude of associated losses have also pushed up insurance prices. This adds to profitability challenges faced by non-life insurers and might widen protection gaps (the proportion of economic losses not covered by insurance), which may adversely affect the macroeconomic situation and financial stability. This highlights the importance of taking policy action to reduce the climate insurance protection gap.[50]
Box 6
Assessing liquidity vulnerabilities in open-ended bond funds: a fund-level redemption coverage ratio approach
Recent changes in the macroeconomic and financial landscape have underscored the need to reassess how liquidity vulnerabilities have evolved for euro area open-ended bond funds. The higher interest rate environment may have implications for open-ended investment funds exposed to interest rate-sensitive assets and sectors, such as high-yield corporate debt. This, together with recent episodes of liquidity stress in the fund sector (such as that seen in March 2020), highlights the need to re-examine the resilience of bond funds to liquidity shocks. Based on a newly constructed, granular dataset of funds’ portfolio holdings and flows,[51] this box explores how funds’ resilience has evolved since the coronavirus (COVID-19) pandemic and resulting market turmoil. It considers the share of high-quality liquid assets (HQLA) in fund portfolio assets as well as funds’ redemption coverage ratio (RCR), calculated by dividing the value of available HQLA stock by net outflows experienced in a severe but plausible scenario lasting 30 days.[52]

5.1 Continue to preserve banking sector resilience to navigate the downturn
In recent months, the euro area macroprudential authorities have continued to strengthen bank resilience by further increasing macroprudential capital buffers. Macroprudential actions have been facilitated by banks’ strong profitability and comfortable capital headroom, which have prevented any procyclical effects (Chart 5.1, panel a) in a context of lower credit demand and heightened aversion to risk on the part of banks.[53] Specifically, macroprudential authorities have increasingly activated countercyclical capital buffers (CCyB), either to address vulnerabilities linked to the build-up of credit risk or to increase macroprudential space in the form of releasable capital buffers. Since the publication of the May 2023 Financial Stability Review, five jurisdictions have either introduced or further tightened the CCyB, bringing the total number of countries with a positive CCyB rate in place to 13 (Chart 5.1, panel b). Thanks to the more active use of this instrument, the weighted average CCyB rate in the banking union rose from 0.23% at the onset of the pandemic to 0.58% in the second quarter of 2023.[54] Since the pandemic, several countries have also introduced sectoral capital buffers to address vulnerabilities in specific sectors such as the residential real estate and corporate sectors.[55]
Chart 5.1
Macroprudential actions have further fostered resilience and increased macroprudential space, while avoiding procyclical effects on lending
|
a) Estimated lending impact of a 1 percentage point increase in capital requirements, depending on ROA and voluntary capital buffers |
b) CCyB rates in participating banking union countries and latest policy action |
|---|---|
|
(percentages) |
(percentages) |
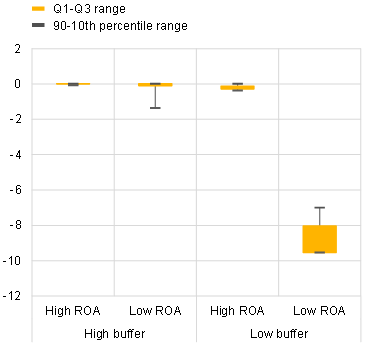 |
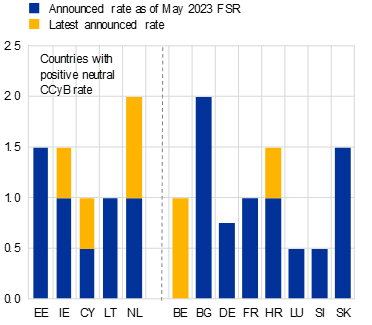 |
Sources: Notifications from national authorities, Eurostat, ECB and ECB calculations.
Notes: Panel a: interquartile range and 90-10th percentile range of the simulated impact on lending of a 1 percentage point increase in capital requirements based on the model in Lang and Menno*. The following category definitions apply: high ROA > 0.5; medium ROA [0.25, 0.5]; low ROA < 0.1; high voluntary capital buffer: greater than median; low voluntary capital buffer: lower than median. ROA stands for return on assets. ROA stands for return on assets. Panel b: announced rates for the CCyB as notified to the ECB by national authorities. The announced rate is already effective in Bulgaria, Germany, Lithuania, Luxembourg and Slovakia, while in other countries it will become effective by the end of 2023 (Estonia and Slovenia) or 2024 (Belgium, Ireland, France, Croatia, Cyprus and the Netherlands), one year after the announcement date.*
*) Lang, J.H. and Menno, D., “The state-dependent impact of changes in bank capital requirements”, Working Paper Series, No 2828, ECB, July 2023.
Macroprudential authorities should preserve macroprudential buffers to ensure that they remain available should conditions deteriorate in the banking sector. The turning of the financial cycle increases the risk that existing vulnerabilities – such as high private sector indebtedness and residential real estate price overvaluation – could lead to a disorderly unravelling. Furthermore, the full impact of tighter financial conditions and weak economic growth on the private sector has yet to be felt. So far there has been no sign of widespread losses, bank profitability is at a historical high, and dividend payouts have increased (Chapter 3). Existing capital buffers should therefore be maintained to preserve available macroprudential space and should only be used if widespread losses (or the expectation of such losses) were to materialise. The availability of releasable capital buffers helps to preserve trust in the banking system during the current challenging period and mitigates the risk that banks might unduly constrain the credit supply if distress were to occur. Furthermore, current levels of banking sector profitability may provide an opportunity for some countries to implement additional targeted increases of macroprudential buffers, which would strengthen macroprudential space. Finally, borrower-based measures should remain in place and continue to act as structural backstops to ensure that lending standards do not deteriorate and that borrowers’ debt remains sustainable. While meeting that objective, the flexibility embedded in the design of borrower-based measures in many countries could help to avoid excessive mortgage supply constraints and preserve credit accessibility for specific segments of borrowers.
Recent initiatives imposing extraordinary taxes on credit institutions in some countries may have negative implications for financial stability. In the current macro-financial environment, it is extremely important to ensure that credit institutions maintain – or where necessary build on – a sound capital base so that they can continue to fulfil their role as credit intermediaries in the economy. In recent opinions on the subject[56], the ECB has highlighted the potential for bank levies to make it harder for banks to build up additional macroprudential capital buffers, which would have negative repercussions on bank resilience and the lending supply should broader distress materialise. Finally, the heterogeneous nature of such extraordinary taxes and the possibility of double taxation for credit institutions operating through branches in different jurisdictions may lead to fragmentation in the European financial system.
Ensure the effectiveness of the regulatory framework for banks
The Basel Committee on Banking Supervision (BCBS) conducted an important stocktake of lessons learnt from the tensions in the US and Swiss banking sectors earlier this year, reaffirming that implementing Basel III remains a priority. A first key finding relates to the crucial role of sound risk management practices and internal governance by banks as a first line of defence. In addition, the BCBS highlighted the importance of strengthening supervisory effectiveness. Moreover, the BCBS has initiated targeted analyses to assess whether specific features of the Basel framework, such as liquidity risk and interest rate risk in the banking book, performed as intended during the March turmoil and will assess the need to explore policy options over the medium term. Notwithstanding the fact that the EU banking sector proved resilient during the turmoil, these lessons learnt and further analyses will offer important insights into potential improvements.
The banking union has made considerable progress in reducing the complexities associated with the failure of systemically important banks active in multiple countries in the banking union. This progress was recognised at the global level in the methodology used to set capital buffers for global systemically important banks (G-SIBs). However, the framework used by the ECB to assess buffers set by national authorities for other systemically important institutions (O-SIIs) continues to treat all cross-jurisdictional activities within the banking union as being equally concerning, from a financial stability perspective, as exposures outside the banking union. The existence of single supervision and resolution mechanisms substantially reduces the frictions which affect the supervision and resolution of internationally active banks, although differences remain as some elements of the banking union are yet to be completed. The ECB is therefore carrying out the technical work required to explore different options for recognising the banking union in its O-SII framework.
5.2 Enhancing the policy framework for non-bank financial intermediation
Parts of the non-bank financial intermediation (NBFI) sector exhibit significant vulnerabilities, highlighting the need to strengthen the resilience of the sector from a macroprudential perspective. Vulnerabilities may arise from liquidity mismatch or leverage across a range of non-bank financial institutions.[57] These vulnerabilities have crystallised during several periods of stress in recent years, notably the March 2020 market turmoil, the failure of Archegos Capital Management in 2021 and the UK government bond (gilt) market stress in 2022. In some cases, extraordinary policy responses from central banks were needed to stabilise markets and limit contagion to the wider financial system.[58] Given the increasingly important role played by the NBFI sector in financing the real economy and its interconnections with the banking system,[59] it is important to tackle the sector’s vulnerabilities to enhance financial stability and support monetary policy in fulfilling its objectives.
A comprehensive set of policy measures should be developed to address vulnerabilities in the NBFI sector holistically. Such an approach would consider interdependencies across different parts of the financial sector as well as interactions between policies, such as those between approaches to tackle liquidity risk and leverage in the NBFI sector. In this context, it is important to recognise the heterogeneous nature of the non-bank financial sector. Different business models and balance sheet structures require that the policy measures will be tailored to specific entity types and their business models. It is also essential to ensure that the economic benefits of any new policy measures exceed their economic costs (e.g. through calibration).
The policy approach should take existing frameworks into account and be rooted in strong international coordination. A macroprudential approach to the NBFI sector should ideally include repurposing existing tools (i.e. by embedding macroprudential perspectives) and consider developing additional macroprudential policies as well as assessing the role of the authorities in implementing them.[60] In addition, the availability and use of granular data and metrics to assess vulnerabilities should be enhanced, including by better information sharing across jurisdictions. Given the pronounced cross-border dimension of NBFI activities, international policy coordination via the Financial Stability Board (FSB) will be an important way to promote a level playing field and minimise the risk of cross-border arbitrage.
The structural vulnerabilities related to liquidity and leverage and their interaction mean it is vital to enhance the resilience of the NBFI sector from several angles. The remainder of this section focuses on policies aimed at (i) enhancing liquidity preparedness to meet large margin and collateral calls in derivatives and repo markets, (ii) containing leverage-related risks in the NBFI sector, and (iii) tackling liquidity mismatch in open-ended funds. Money market fund reforms are discussed briefly at the end of the section.
Inadequate liquidity preparedness to meet margin and collateral calls can precipitate adverse feedback dynamics and amplify market-wide stress. Market participants may be forced to sell assets in periods of market stress, which can depress asset prices further and, in turn, accelerate margin calls, potentially transforming individual liquidity stress into a system-wide issue. This was the case in September 2022, when a sudden increase in gilt yields led to UK pension funds facing large margin calls on their interest rate derivative positions, prompting them to sell long-dated government bonds in thin underlying markets.[61] Similarly, the large margin calls faced by EU insurance corporations and pension funds in March 2020 triggered significant outflows from money market funds, which amplified the stress across the wider financial system.[62]
It is therefore important to enhance the preparedness of NBFI sector entities to cope with liquidity needs stemming from large margin and collateral calls. Strengthening the governance and liquidity risk management of a broad range of non-bank entities, including investment funds, insurance corporations and pension funds, is the most direct way to enhance liquidity preparedness. The table below summarises promising policy options. These include enhancing contingency planning and governance, using liquidity stress testing and ensuring that there are appropriate levels of liquidity buffers and that liquidity sources are diversified.
Policies should consider the trade-off between enhancing resilience to liquidity stress and wider economic costs and be calibrated in a way that ensures benefits outweigh costs. In addition, liquidity preparedness should be proportional to liquidity risk and should reflect the size of potential margin calls and the interplay with leverage. In this respect, liquidity stress testing and contingency planning may be useful when calibrating the appropriate level of liquidity buffers and the diversification of liquidity sources.
Policy options for enhancing non-banks’ preparedness to meet margin and collateral calls
While enhancing liquidity preparedness is mainly the responsibility of market participants, complementary measures related to margining practices and the resilience of liquidity provision should be considered. To that end, it would be useful to enhance transparency and reduce procyclicality in margin and collateral calls. For example, recent stress episodes have highlighted the need for greater transparency in the margin models of central counterparties and clearing members. This could entail gathering more information about how margin models work (e.g. information on discretionary add-ons/multipliers) and using better data and tools (e.g. margin simulators). In addition, enhancing collateral transformation services and improving the resilience of repo and cash bond markets could be beneficial for the liquidity preparedness of NBFI sector entities.
Both entity-based and activity-based measures should be used to address the risks related to NBFI sector leverage. Entity-based measures, such as rules that restrict leverage for certain NBFI sector entities, should be complemented by measures affecting certain activities (such as derivative or repo transactions) used to generate leverage. Given the complexities involved in the use of leverage in an interconnected financial system, the policy response should also take a holistic perspective which takes into account interactions with policies targeting liquidity risk. For instance, leverage limits could reduce the size of margin calls faced by non-bank financial institutions. At the same time, enhanced liquidity risk management would mitigate the need for forced asset sales, something which could have particularly strong amplifying effects for highly leveraged financial intermediaries.
A globally consistent approach for measuring risks stemming from both financial and synthetic leverage would make it possible to monitor such risks more effectively.[63] For this purpose, it is important to continue to develop globally consistent metrics and improve data quality and coverage as well as cross-jurisdictional information sharing. This will make it easier to assess leverage-related risks across NBFI sector entities, activities and jurisdictions.[64]
One key aspect of policy would be to consider leverage restrictions for different types of NBFI sector entity. This could include setting concrete leverage limits and/or using discretionary restrictions for types of entity with similar risk exposures.[65] Calibrating such limits would require an assessment of appropriate levels of leverage for NBFI sector entities – this should take into account the specific business models of different entities, the economic benefits of such leverage and the level of leverage-induced externalities that the financial system could withstand. Stress testing could be informative in this case. It is also important to ensure that any regulatory requirements are not circumvented and that the authorities can address any arbitrage promptly should it occur.
Enhancing prudential rules on haircuts and margins for securities financing (including repos) and derivative transactions should also be part of the approach to address NBFI sector leverage. Since not all NBFI sector entities would be subject to direct leverage constraints, a higher initial margin during periods of low market volatility would operate as a backstop limiting both the amount of leverage created through derivative exposures (synthetic leverage) and margin procyclicality. With regard to securities financing transactions, it is important to swiftly implement the FSB minimum haircut framework in European law. At the same time, the rules on haircuts and margins could have potentially adverse consequences for the cost of hedging for end users, highlighting the need to carefully balance benefits and costs.
Finally, as part of a holistic approach it is important to consider how prime brokers and dealer banks facilitate NBFI leverage in accordance with their risk management practices and regulation. This is another important complementary aspect to consider with regard to mitigating the build-up of leverage in the NBFI sector globally, especially for entities that are not subject to regulatory leverage constraints.
A key policy objective concerning liquidity mismatch in open-ended funds (OEFs) is to better align fund redemption terms with the liquidity of portfolio assets. The FSB has recently published proposals in support of this objective.[66] In particular, the daily creation and redemption of fund shares would remain appropriate for funds that invest mainly in assets that are liquid under both normal and stressed market conditions (e.g. certain listed equities or government bonds). For funds invested in assets that are relatively less liquid during normal periods, but which could become illiquid under stress, such as corporate bond funds, daily redemptions may be appropriate if the asset manager can demonstrate to the authorities that higher standards of liquidity management are being met. However, the asset manager should consider longer notice periods or a lower redemption frequency to reduce liquidity mismatch vulnerability if the costs of selling assets cannot be passed on to redeeming investors by anti-dilution tools. Finally, it would not be appropriate for OEFs holding a significant share of assets (such as real estate assets) that are illiquid even under normal market conditions to offer daily liquidity to investors. National regulators and authorities supervising property funds in the EU have devised a range of policy measures to limit the liquidity mismatch in such funds.[67]
Enhancing the availability and use of anti-dilution liquidity management tools should form part of the policy response to vulnerabilities in the OEF sector.[68] In particular, OEFs should be able to pass on to redeeming investors both the explicit and the implicit costs of selling assets under both normal and stressed market conditions to reduce first-mover advantages and disincentivise procyclical investor redemptions. This could be achieved by employing price-based anti-dilution tools such as swing pricing or anti-dilution levies, especially for funds invested in less liquid assets.[69] However, price-based liquidity management tools could be difficult to use in stressed market conditions when liquidity has dried up and price information could be missing or distorted. Therefore, to ensure that withdrawals do not cause liquidity strains under such conditions, redemption terms should be commensurate with asset liquidity. In particular, as discussed above, longer notice periods might be warranted for funds investing in less liquid assets, and higher liquidity buffers might be needed for funds offering daily redemptions.
Money market fund (MMF) reforms in the EU should be pursued as a matter of priority, in line with the international policy proposals. Following the March 2020 market turmoil, proposals to enhance the resilience of MMFs without unduly curtailing their economic function were developed at both the international and the European levels. The proposals focused on removing regulatory threshold effects, strengthening MMF liquidity requirements and improving the availability and usability of liquidity management tools.[70] In the EU, however, reform of MMFs has seen limited progress to date. While MMFs will be required to have at least two liquidity management tools, as is the case for other funds, no legal reforms have as yet been proposed to the dedicated EU Money Market Fund Regulation.[71] In the United States, the authorities have adopted significant MMF reforms, such as raising liquidity requirements to 25% and 50% of a fund’s total assets for daily and weekly liquid assets respectively.[72] As the United States and other jurisdictions are progressing with legal reforms, updating the EU’s MMF framework should be pursued as a matter of priority.
5.3 Other ongoing policy initiatives that support euro area financial stability
|
Topic |
Recent initiatives |
|---|---|
|
Banking package |
Implementation of the latest banking package in the EU, including the final Basel III elements, is currently under way. The ECB has published its views on the banking package reforms and welcomes the agreement reached by the EU co-legislators on 27 June 2023. This will make it possible to finalise the legal process in time to meet the target date for initial application (1 January 2025). The EU implementation is in line with the overall objectives of the Basel III framework and will apply to all EU banks. The reforms will further bolster the resilience of the banking system, especially by increasing the capital needed for credit, operational and market risks. |
|
Crisis management and deposit insurance |
Improving the toolkit used to address the failures of smaller and mid-sized banks is at the centre of the European Commission’s proposed reform of the crisis management and deposit insurance framework. The aim of the reforms is to mitigate risks to financial stability, improve the protection of depositors and avert the use of public funds in banking crises by extending the availability of effective crisis management options such as transfer tools to a broader set of banks. Loss absorption by shareholders and creditors will remain the first line of defence in a bank failure. The ECB strongly welcomed the proposal in its opinion. While outside the scope of the Commission’s proposal, the ECB noted that a number of further actions are still warranted to strengthen the resilience of the European bank crisis management framework: (i) the introduction of a European deposit insurance scheme, which would buttress depositor confidence, even in a systemic crisis; (ii) the establishment of a common backstop to the Single Resolution Fund, which would bolster the firepower available to support bank resolutions in the banking union; and (iii) the introduction of a European backstop for liquidity in resolution, which is essential to ensure market confidence in a bank during and after its resolution. |
|
Crypto-assets |
The regulation of crypto-asset activities is advancing at both European and international levels. In the EU, the Markets in Crypto-assets Regulation entered into force in June 2023, containing provisions applicable to stablecoins (e-money tokens and asset-referenced tokens as defined by the regulation) from June 2024 and to other crypto-assets and the provision of crypto-asset services from December 2024. In the meantime, the European Banking Authority and the European Markets and Securities Authority are consulting on a first set of technical standards to implement the regulation. At the international level, the Financial Stability Board (FSB) has published a Global Regulatory Framework for Crypto-asset Activities providing high level recommendations for regulating crypto-asset activities and markets and global stablecoin arrangements. Implementing these recommendations across FSB jurisdictions and beyond will be key to promoting consistency and international cooperation in these areas. Furthermore, the IMF-FSB synthesis paper represents an important step forward in the implementation process as it brings together regulatory and macro-financial considerations related to crypto-assets. It also outlines the next steps international organisations and standard-setting bodies will take to implement crypto-asset policy frameworks aimed at addressing macroeconomic and financial stability risks. |
|
Digital euro |
On 28 June 2023 the European Commission published its Single Currency Package, comprising a legislative proposal for the establishment of the digital euro and a legislative proposal on the legal tender of euro cash. The ECB warmly welcomed the proposal settling the legal framework for a possible digital euro that would be widely usable and largely available in the digital economy and would complement euro banknotes and coins. The legal foundation of the digital form of the euro would also ensure that central bank money would continue to contribute significantly to a resilient, efficient and well-functioning payment system. The ECB received the consultation requests from the Council of the European Union and the European Parliament in September and will publish its opinion within three months. The legislative act is expected to be adopted by the end of 2024 at the earliest. The two-year investigation phase for the digital euro project concluded in October 2023 when the ECB’s Governing Council decided to launch the next phase of the programme, the preparation phase.[73] However, the issuance of a digital euro would require a separate Governing Council decision and would be taken only after the legislative act has been adopted. |
|
Capital markets union |
On 24 May 2023 the European Commission published a proposal for a retail investment strategy as part of its 2020 Capital Markets Union Action Plan. The aim of the proposal is to enable retail investors to make well-informed financial decisions by ensuring that information is provided in a more standardised format, by increasing the transparency and comparability of cost structures and by addressing potential conflicts of interests (e.g. by not allowing inducements for “execution-only” sales or by protecting retail investors from misleading marketing campaigns). A further aim of the Commission’s proposal is to implement measures which could reduce administrative burdens and improve the accessibility of products and services. In addition, the proposal brings forward measures aimed at enhancing supervisory cooperation to ensure consistent implementation throughout the EU. |
A Assessing risks from euro area banks’ maturity transformation
This special feature builds on the concept of maturity gap as a metric of banks’ maturity mismatch to shed light on how banks’ engagement in maturity transformation differs across euro area countries and bank types. Banks can mitigate the interest rate risk stemming from their maturity mismatch by using derivatives for hedging purposes. Euro area banks increased their positions in interest rate derivatives over the last two years in anticipation of the start of monetary policy normalisation. Significant institutions rely more than cooperative and savings banks on interest rate derivatives and have a more diversified positioning. The extent of banks’ maturity mismatch determines the sensitivity of their net interest income to changes in interest rates and the slope of the yield curve. This special feature provides empirical evidence that the more banks engage in maturity transformation the more their net interest margin benefits from a steepening of the yield curve, boosting bank profits. This effect might dissipate going forward, especially for banks in countries where variable-rate lending predominates.
B Real estate markets in an environment of high financing costs
Tighter financing conditions have reduced the affordability of and demand for real estate assets, putting downward pressure on prices. They have also increased the debt service costs faced by existing borrowers, with more-indebted borrowers in countries with widespread variable-rate lending being the most affected. Robust labour markets have thus far supported household balance sheets, thereby mitigating credit risk in banks’ relatively large residential real estate exposures. Commercial real estate firms, by contrast, have faced more severe challenges in a context of rising financing costs and declining profitability. While banks have smaller exposures to commercial real estate markets, losses in this segment could act as an amplifying factor in the event of a wider shock.
The Financial Stability Review assesses the sources of risks to and vulnerabilities in the euro area financial system based on regular surveillance activities, analysis and findings from discussions with market participants and academic researchers.
The preparation of the Review was coordinated by the ECB’s Directorate General Macroprudential Policy and Financial Stability. The Review has benefited from input, comments and suggestions from other business areas across the ECB. Comments from members of the ESCB Financial Stability Committee are gratefully acknowledged.
The Review was endorsed by the ECB’s Governing Council on 15 November 2023.
Its contents were prepared by Desislava Andreeva, Pierce Daly, Daniel Dieckelmann, John Fell, Sándor Gardó, Paul Hiebert, Annalaura Ianiro, Benjamin Klaus, Thore Kockerols, Mara Pirovano, Andrzej Sowiński, Manuela Storz, Christian Weistroffer and Jonas Wendelborn.
With additional contributions from Jakob Adolfsen, Marcus Bierich, Lorenzo Cappiello, Soma Gecse, Maciej Grodzicki, Lieven Hermans, Nathan Huber, Paulina Jacobsen, Barbara Jarmulska, Sujit Kapadia, Kateryna Koroliuk, Georgi Krustev, Peter McQuade, Caterina Negri, Charles O’Donnell, Cristian Perales, Moreno Roma, Ellen Ryan, Beatrice Scheubel, Michal Slavik, Seng-Guan Toh, Elisa Telesca, Michael Wedow and Balázs Zsámboki.
Editorial, multimedia and production assistance was provided by Maria Canelli, Marina Decker, Paula González Escribano, Anna Heckler, Peter Nicholson and Verena Reith.
© European Central Bank, 2023
Postal address 60640 Frankfurt am Main, Germany
Telephone +49 69 1344 0
Website www.ecb.europa.eu
All rights reserved. Reproduction for educational and non-commercial purposes is permitted provided that the source is acknowledged.
For specific terminology please refer to the ECB glossary (available in English only).
PDF ISSN 1830-2025, QB-XU-23-002-EN-N
HTML ISSN 1830-2025, QB-XU-23-002-EN-Q


