

Published as part of the Financial Stability Review, May 2022.
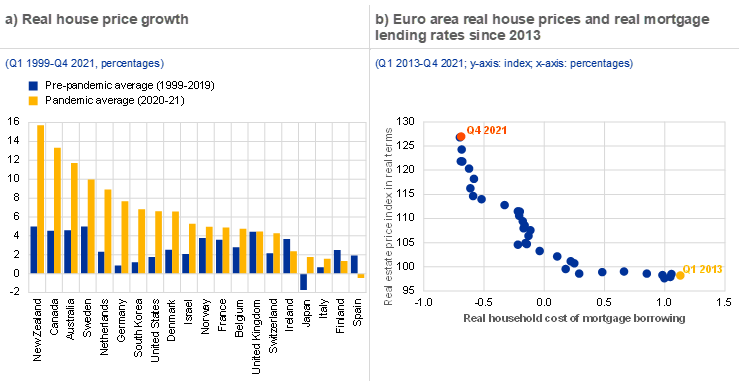
House prices increased substantially during the pandemic, fuelling concerns about possible price reversals and their implications for financial stability. In many advanced economies, real house price growth exceeded 4% during the pandemic (Chart A, panel a), reaching 4.3% in the euro area in the fourth quarter of 2021[1] amid signs of exuberance in some countries.[2] At the same time, real mortgage lending rates in the euro area have fallen further to reach historic lows in the current low interest rate environment (Chart A, panel b).[3] Against this backdrop, this box discusses the main drivers of recent house price increases across advanced economies and in the euro area, and the associated risks of possible price reversals and the potential implications for financial stability.
Chart A
Strong house price growth in advanced economies coincides with the period of low interest rates
Sources: Federal Reserve Bank of Dallas, ECB and ECB calculations.
Notes: Panel a: real house price growth across advanced economies is measured year on year and seasonally adjusted; the dataset is described in Mack and Martínez-García*. The trends observed during the pandemic are compared with observations during the 20 years before the pandemic. Panel b: real mortgage lending rates are computed as country-specific average nominal mortgage lending rates minus the ECB’s inflation target of 2%.
*) Mack, A. and Martínez-García, E., “A Cross-Country Quarterly Database of Real House Prices: A Methodological Note”, Working Paper Series, No 99, Globalization and Monetary Policy Institute, Federal Reserve Bank of Dallas, 2011.
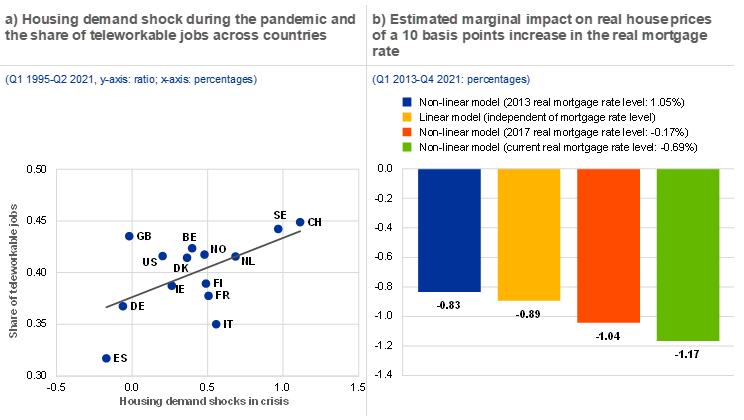
Shifts in housing preferences and low interest rates have been important drivers of recent strong house price growth across advanced economies. Estimates based on country-specific Bayesian vector autoregression (BVAR) models indicate that the house price increases across advanced economies during 2020-21 were mainly driven by increased demand for housing. There is a positive correlation between the magnitude of the estimated housing demand shock across countries and the share of teleworkable jobs, signalling that the housing demand shocks are related to a shift in housing preferences during the pandemic (Chart B, panel a), possibly reflecting a desire for more space coupled with less need for commuting.[4] Increased demand for housing could also be related to search-for-yield behaviour in the low-yield environment. In addition, monetary policy shocks combined with mortgage supply shocks contributed to the recent house price increases across advanced economies, including the euro area. Unlike housing demand shocks, monetary policy and mortgage supply shocks move interest rates and house prices in opposite directions.
Chart B
A reversal in housing preferences or an abrupt increase in real interest rates could induce house price corrections, with potential adverse implications for macro-financial stability
Sources: Federal Reserve Bank of Dallas, Dingel and Neiman*, Haver Analytics, ECB and ECB staff calculations.
Notes: Panel a: average standardised housing demand during the pandemic (Q1 2020-Q2 2021) and the share of teleworkable jobs from Dingel and Neiman*. The authors classify the feasibility of working at home for all occupations and merge this classification with occupational employment counts, but no values are provided for Australia, Canada, Israel, Japan, South Korea and New Zealand. The estimation results come from structural country-specific BVAR models in the spirit of Calza et al.** and Nocara and Roma***, with the following structural shocks: monetary policy, housing demand, mortgage supply, aggregate demand and aggregate supply, identified with a combination of sign and zero restrictions as well as a max share approach for the housing demand shock. The model includes the following variables: household credit, consumer prices index, real GDP, real house price, interest rate/shadow rate and the real effective exchange rate. For all the countries except the United States, the model includes cross-country average interest rate/shadow rate, CPI and GDP as block-exogenous. Estimation sample starts later than Q1 1995 for a few countries due to data limitations. Panel b: house price responses from an asset-pricing model where real house prices are explained with current real rents in the numerator and the expected long-term real interest rate plus the risk premium minus the expected future real rent growth in the denominator. “Linear model” denotes a formulation in log-levels, “Non-linear model” in log-logs. The models use euro area country-level data from Q1 2013 to Q4 2021 and account for country fixed effects.
*) Dingel, J.I. and Neiman, B., “How many jobs can be done at home?”, Journal of Public Economics, Vol. 189, 2020.
**) Calza, A., Monacelli, T. and Stracca, L., “Housing finance and monetary policy”, Journal of the European Economic Association, Vol. 11, pp. 101-122.
***) Nocera, A. and Roma, M., “House prices and monetary policy in the euro area: evidence from structural VARs”, Working Paper Series, No 2073, ECB, 2017.
In the current low interest rate environment, increased sensitivity of house price growth to changes in real interest rates makes substantial house price reversals more likely. Evidence for the euro area shows that a model with an interest rate-dependent sensitivity of real house prices to real interest rates outperforms a model with a constant sensitivity. Such a non-linear model is consistent with asset pricing theory and implies that the lower the level of the real interest rate, the larger should be the response of house prices for a given change in that rate.[5] Given the current low level of interest rates, therefore, potential reversals in residential real estate prices could be larger than several years ago, especially if interest rates increased sharply. In particular, the comparison between estimated linear and non-linear models (Chart B, panel b) for the euro area shows that the estimated house price response to a 0.1 percentage point increase in real mortgage rates from the current very low level is around 28 basis points stronger when accounting for non-linear relationships (Chart B, panel b).[6]
An abrupt repricing in the housing market – if the demand for housing were to go into reverse, for example, or real interest rates were to rise significantly – could produce spillovers to the wider financial system and economy. Such price reversals in housing markets could reflect a return to pre-pandemic work modalities or a strong increase in real interest rates. Other possible factors include a change in investor preferences for holding residential real estate assets, as well as a more general deterioration in risk sentiment related to an exacerbation of geopolitical risks or progressing climate change. The BVAR models described above indicate that a 1% drop in house prices due to a shift in housing demand could, on average across countries, generate a peak drop in real GDP of 0.2% after two years. However, the decline varies from country to country, with a fall of up to 0.9% in some advanced economies and wide uncertainty bands around these estimates. To cushion adverse financial stability implications of potential house price reversals, a tightening of macroprudential measures seems warranted in some countries, especially where strong house price growth has been accompanied by buoyant credit dynamics.[7]


