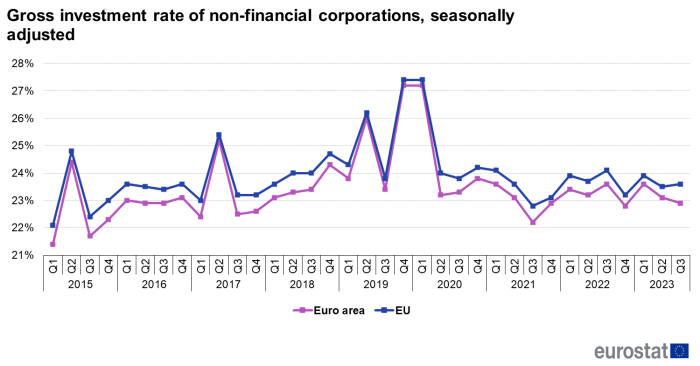
Business investment rate slightly down in the euro area and nearly stable in the EU
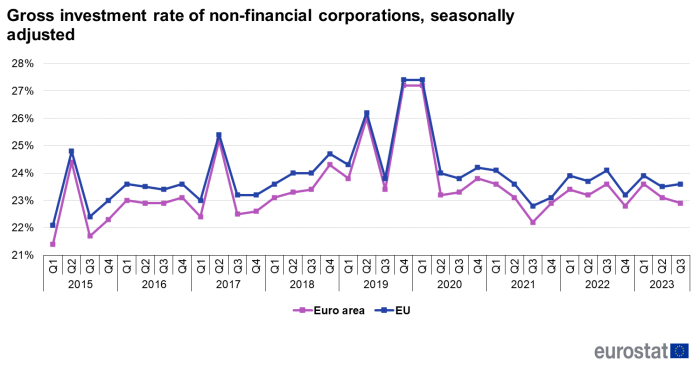
The business investment rate in the euro area (EA-20) went slightly down from 23.1 % in the previous quarter to 22.9 % in the third quarter of 2023 . In the EU, the investment rate remained nearly stable, reaching 23.6 % in the third quarter of 2023, compared with 23.5 % in the previous quarter. The peaks in 2015Q2, 2017Q2, 2019Q2, 2019Q4 and 2020Q1 can be attributed to imports of intellectual property products reflecting the impact of globalisation.
These data come from a detailed set of seasonally adjusted[1] quarterly European sector accounts released by Eurostat, the statistical office of the European Union and the European Central Bank (ECB).
Declining business profit in the euro area and the EU
The business profit share dropped in both the euro area and the EU during the third quarter of 2023. In the euro area, the profit share dropped from 40.6 % to 40.2 %, while in the EU, it decreased from 41.4 % to 40.6 %.
The decline in profit share within the euro area can be attributed to a modest increase in business gross value added (+0.8 %), while compensation of employees (wages and social contributions) plus taxes less subsidies on production saw a higher rise of 1.5 %. On the other hand, investment (gross fixed capital formation) showed a decrease of 0.2 % in the euro area, explaining the decline of business investment rate.
Data sources
The compilation of the European sector accounts follows the European System of Accounts 2010 (ESA 2010) and covers the period from the first quarter of 1999 onwards.
Institutional sectors bring together economic units with broadly similar characteristics and behaviour, namely: households (including non-profit institutions serving households), non-financial corporations, financial corporations, government and the rest of the world. In the latter, to measure the external transactions of the euro area / EU, it is necessary to remove cross-border flows within the area concerned.
The ECB and Eurostat publish integrated non-financial and financial accounts, including financial balance sheets, for the euro area. Eurostat also publishes the non-financial accounts of the European Union.
Eurostat’s website includes detailed annual sector accounts by country and derived key indicators, which also include the indicators that combine non-financial and financial accounts, such as debt-to-income ratios.
Eurostat’s website includes detailed sequence of accounts and derived key indicators, which also include the indicators that combine non-financial and financial accounts such as debt-to-income ratios.
The full set of quarterly sector accounts is published for euro area / EU aggregates. Quarterly sector accounts data are also available for most of the European Economic Area (EEA) Member States in the Eurostat database and a subset of quarterly key indicators is published around 102 days after each quarter at quarterly data and annual data. The EEA members whose GDP is below 1 % of the EU total do not have to transmit the quarterly accounts of households to Eurostat.
General information on European sector accounts compilation is given in the metadata file.
For detailed data and methodology, please see Eurostat’s website and ECB’s website.
- The European Union (EU) consists of 27 Member States: Belgium, Bulgaria, Czechia, Denmark, Germany, Estonia, Ireland, Greece, Spain, France, Croatia, Italy, Cyprus, Latvia, Lithuania, Luxembourg, Hungary, Malta, the Netherlands, Austria, Poland, Portugal, Romania, Slovenia, Slovakia, Finland and Sweden plus the EU institutions.
- The euro area (EA-20) consists of 20 Member States: Belgium, Germany, Estonia, Ireland, Greece, Spain, France, Croatia, Italy, Cyprus, Latvia, Lithuania, Luxembourg, Malta, the Netherlands, Austria, Portugal, Slovenia, Slovakia and Finland, plus the European Central Bank, the European Stability Mechanism and the European Financial Stability Facility. From 1 January 2023, the euro area (EA-20) also includes Croatia. The aggregate data series presented in this article refer to EA-20.
Source data for tables and graphs
The detailed tables ![]() are available here.
are available here.


.png)


