DNY59
What are the choices for monitoring and estimating recession risk? Slightly lower than the number of stars in the universe. Ok, I’m exaggerating, but not much. The good news: the search for robust, relatively reliable indicators narrows the field dramatically. But there’s always more to learn, in part because the supply of data sets is vast, increasingly so. Which brings me to another indicator that looks promising: state coincident indexes.
Every state’s economy is, in some degree, unique, although the gravitational pull of the national economy casts a long shadow. Tracking each state economy separately, and then aggregating the results, provides a different spin on the US business cycle compared with national indicators. Think of it as a bottom-up model vs. the standard top-down approach via US retail sales, industrial production, etc.
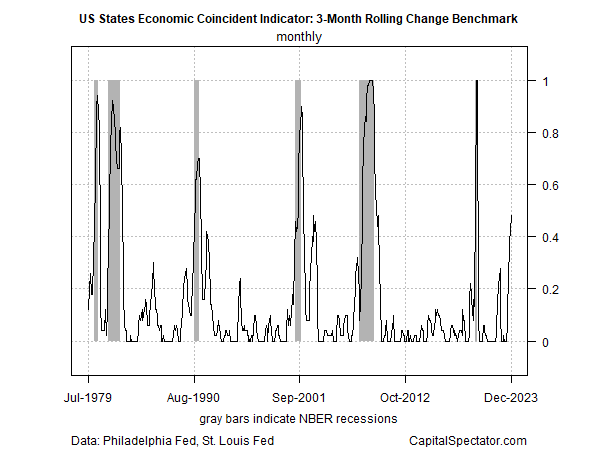
Conveniently, the Philly Fed publishes monthly coincident indicators for each state. Aggregating the 50 signals into a composite index provides a somewhat different view of the US business cycle vs. traditional top-down metrics. There are several ways to process the numbers – my preference, shown in the chart below, is a 3-month change model. If a state’s 3-month change is negative (positive), the signal is negative (positive). Summing the negatives and positives provides a national profile. The current reading is 0.48 — in other words, 48% of the states are posting negative 3-month changes for their respective coincident indicator. As shown below, the composite reading maps fairly closely with NBER-defined downturns, and so the current signal is issuing a warning, albeit a warning that has yet to provide what might be thought of as passing the point of no return. But it’s close.

The readings vary from 0 (no negative 3-month changes) to 1.0 (all 50 states are reporting negative 3-month changes). A quick review of the historical record suggests that the US is on the verge of slipping into recession.
But before we ring the alarm bell, there are some caveats to consider. First, a similarly high reading 20-plus years ago turned out to be a false signal. The next couple of months will likely determine if a repeat performance is brewing, or not.
Second, no one indicator is flawless, as we’ve learned over the last couple of years – especially in recent history, when pandemic-related events have created no shortage of macro surprises.
Another reason to reserve judgment, at least for now: a range of other business cycle indicators tracked in The US Business Cycle Risk Report (a sister publication of CapitalSpectator.com) continue to show a clear growth bias. But as reported in this week’s issue, there are some nascent signs of softer economic activity, and so it’s possible that the coincident state indicators are an early warning that the tide is shifting.
The most reliable methodology for estimating recession risk in real-time is building an ensemble model that combines various modeling applications that are complementary. Although any one model will excel at a given point in time, quite often the best-performing indicator changes through time. To minimize the risk that’s inherent in any one signal, The US Business Cycle Risk Report crunches the numbers on multiple indicators, which has proven to be close to optimal for balancing the need for timely signals that minimize false signaling.
Despite the caveats, the coincident state model adds another dimension to the mix and provides some complimentary input to The US Business Cycle Risk Report’s existing suite of indicators. Accordingly, I’ll be adding the composite state coincident data to the newsletter’s weekly updates.
The next batch of coincident state updates for January is scheduled for later this month. Meantime, I’ll be carefully reviewing the incoming data for fresh clues that support or reject the suggestion that trouble’s brewing via the state coincident indicators.
Editor’s Note: The summary bullets for this article were chosen by Seeking Alpha editors.


