

Data Through Q4 2022
Introduction
The CoreLogic Homeowner Equity Insights report, is published quarterly with coverage at the national, state and metro level and includes negative equity share and average equity gains. The report features an interactive view of the data using digital maps to examine CoreLogic homeowner equity analysis through the fourth quarter of 2022.
Negative equity, often referred to as being “underwater” or “upside down,” applies to borrowers who owe more on their mortgages than their homes are worth. Negative equity can occur because of a decline in home value, an increase in mortgage debt or both.
This data only includes properties with a mortgage. Non-mortgaged properties (that are owned outright) are not included.
Homeowner Equity Q4 2022
CoreLogic analysis shows U.S. homeowners with mortgages (roughly 63% of all properties*) have seen their equity increase by a total of $1 trillion since the fourth quarter of 2021, a gain of 7.3% year over year.
*Homeownership mortgage source: 2016 American Community Survey.

Negative Equity Down From Q4 2022
In the fourth quarter of 2022, the total number of mortgaged residential properties with negative equity increased by 6% from the third quarter of 2022 to 1.2 million homes, or 2.1% of all mortgaged properties. On a year-over-year basis, negative equity fell by 2% from 1.2 million homes, or 2.2% of all mortgaged properties, in the fourth quarter of 2021.
Because home equity is affected by home price changes, borrowers with equity positions near (+/- 5%) the negative equity cutoff are most likely to move out of or into negative equity as prices change, respectively. Looking at the fourth quarter of 2022 book of mortgages, if home prices increase by 5%, 145,000 homes would regain equity; if home prices decline by 5%, 215,000 would fall underwater. The CoreLogic HPI Forecast TM projects home prices will increase by 3% from December 2022 to December 2023.

Home Equity Gains Dip Sharply From Q1 to Q4
As U.S. home price growth continued its slow, steady decline in the final months of 2022, home equity trends naturally followed suit. In the fourth quarter of 2022, the average borrower earned about $14,300 in equity year over year, compared with the $63,100 gain seen in the first quarter of 2022.
Four Western states and one district posted annual home equity decreases: Idaho (-$21,400), Washington (-$18,900), California (-$8,500), Utah (-$4,600) and Washington, D.C. (-$8,300). This partially mirrors trends recorded in CoreLogic’s latest Home Price Index (HPI), which found that Idaho, Washington and Washington, D.C. saw home price growth decline slightly year over year in January 2023.
On the flip side of the coin, Florida homeowners saw the highest annual equity growth in the fourth quarter, at $49,000. Florida has posted the largest year-over-year home price gains in the country for the past year, according to HPI data, with prices up by 13.4% in January.
National Aggregate Value of Negative Equity: Q4 2022
The national aggregate value of negative equity was approximately $332 billion at the end of the fourth quarter of 2022. This is up quarter over quarter by approximately $12.5 billion, or 3.9%, from $ 319.8 billion in the third quarter of 2022 and up year over year by approximately $40.3 billion, or 13.8%, from $292 billion in the fourth quarter of 2021.
Negative equity peaked at 26% of mortgaged residential properties in the fourth quarter of 2009, based on the CoreLogic equity data analysis which began in the third quarter of 2009.

“While equity gains contracted in late 2022 due to home price declines in some regions, U.S. homeowners on average still have about $270,000 in equity, nearly $90,000 more than they had at the onset of the pandemic. Even in Idaho, where borrowers were the most vulnerable to losses, the typical homeowner with a mortgage still has about $250,000 in remaining home equity.
Nevertheless, with 66,000 borrowers entering negative equity in the fourth quarter, the total number of underwater properties is now approaching levels seen at the end of 2021, which was the lowest since the Great Recession. The new hot spots for equity declines are largely markets that have seen the most significant home price deceleration, including Boise, Idaho; the San Francisco Bay Area; cities in Utah; Phoenix and Austin, Texas.”
– Selma Hepp, Chief Economist for CoreLogic
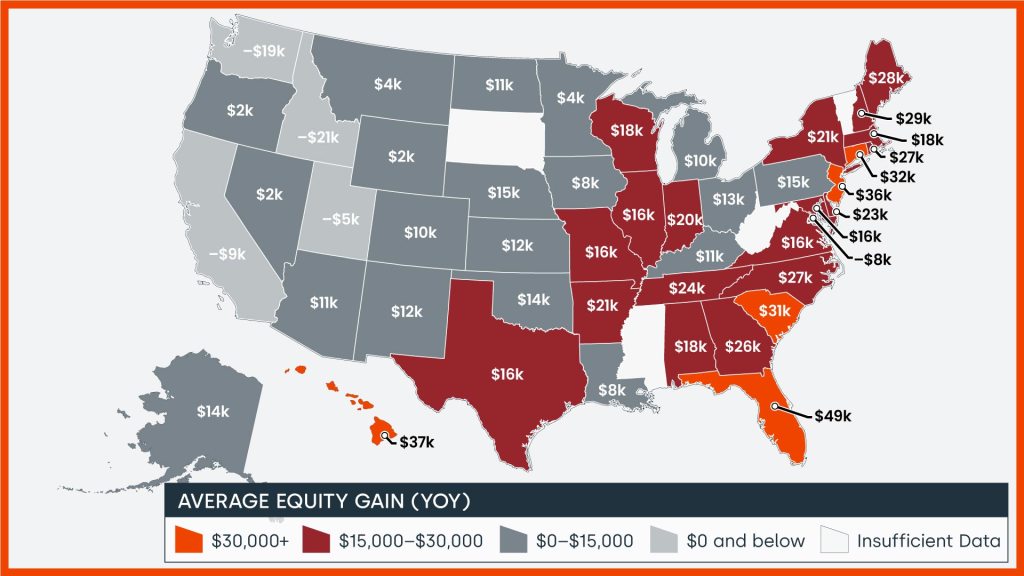
National Homeowner Equity
In the fourth quarter of 2022, the average U.S. homeowner gained approximately $14,300 in equity during the past year.
Florida, Hawaii and New Jersey experienced the largest average equity gains at $49,000, $37,100 and $35,900 respectively. Idaho, Washington, California, Utah and Washington, D.C. saw annual equity losses.
10 Select Metros Change
CoreLogic provides homeowner equity data at the metropolitan level, in this graphic 10 of the largest cities, by housing stock are depicted.
Negative equity has seen a recent decrease across the country. Las Vegas, Los Angeles and San Francisco are the least challenged, with Negative Equity Shares of all mortgages at 0.9%.

Loan-to-Value Ratio (LTV)
This chart shows National Homeowner Equity Distribution across multiple LTV Segments.

Summary
CoreLogic began reporting homeowner equity data in the first quarter of 2010; at that time, the equity picture for homeowners was rather bleak in the United States. Since then, many homes have regained equity and the outstanding balance on the majority of mortgages in this country are now equal to or in a positive position when compared to their loan balance.
CoreLogic will continue to report on homeowner equity as it continues to adjust in communities and states across the country. To learn more about homeowner equity, visit the CoreLogic Insights page on www.corelogic.com.
Methodology
The amount of equity for each property is determined by comparing the estimated current value of the property against the mortgage debt outstanding (MDO). If the MDO is greater than the estimated value, then the property is determined to be in a negative equity position. If the estimated value is greater than the MDO, then the property is determined to be in a positive equity position. The data is first generated at the property level and aggregated to higher levels of geography. CoreLogic uses public record data as the source of the MDO, which includes more than 50 million first- and second-mortgage liens, and is adjusted for amortization and home equity utilization in order to capture the true level of MDO for each property. Only data for mortgaged residential properties that have a current estimated value are included. There are several states or jurisdictions where the public record, current value or mortgage data coverage is thin and have been excluded from the analysis. These instances account for fewer than 5% of the total U.S. population. The percentage of homeowners with a mortgage is from the 2019 American Community Survey. Data for the previous quarter was revised. Revisions with public records data are standard, and to ensure accuracy, CoreLogic incorporates the newly released public data to provide updated results.
CoreLogic HPI Forecasts™ are based on a two-stage, error-correction econometric model that combines the equilibrium home price—as a function of real disposable income per capita—with short-run fluctuations caused by market momentum, mean-reversion, and exogenous economic shocks like changes in the unemployment rate. With a 30-year forecast horizon, CoreLogic HPI Forecasts project CoreLogic HPI levels for two tiers — “Single-Family Combined” (both attached and detached) and “Single-Family Combined Excluding Distressed Sales.” As a companion to the CoreLogic HPI Forecasts, Stress-Testing Scenarios align with Comprehensive Capital Analysis and Review (CCAR) national scenarios to project five years of home prices under baseline, adverse and severely adverse scenarios at state, metropolitan areas and ZIP Code levels. The forecast accuracy represents a 95% statistical confidence interval with a +/- 2% margin of error for the index.
Source: CoreLogic
The data provided is for use only by the primary recipient or the primary recipient’s publication or broadcast. This data may not be re-sold, republished or licensed to any other source, including publications and sources owned by the primary recipient’s parent company without prior written permission from CoreLogic. Any CoreLogic data used for publication or broadcast, in whole or in part, must be sourced as coming from CoreLogic, a data and analytics company. For use with broadcast or web content, the citation must directly accompany first reference of the data. If the data is illustrated with maps, charts, graphs or other visual elements, the CoreLogic logo must be included on screen or website. For questions, analysis or interpretation of the data, contact Robin Wachner at [email protected]. For sales inquiries, please visit https://www.corelogic.com/support/sales-contact/. Data provided may not be modified without the prior written permission of CoreLogic. Do not use the data in any unlawful manner. This data is compiled from public records, contributory databases and proprietary analytics, and its accuracy is dependent upon these sources.
About CoreLogic
CoreLogic is a leading global property information, analytics and data-enabled solutions provider. The company’s combined data from public, contributory and proprietary sources includes over 4.5 billion records spanning more than 50 years, providing detailed coverage of property, mortgages and other encumbrances, consumer credit, tenancy, location, hazard risk and related performance information. The markets CoreLogic serves include real estate and mortgage finance, insurance, capital markets, and the public sector. CoreLogic delivers value to clients through unique data, analytics, workflow technology, advisory and managed services. Clients rely on CoreLogic to help identify and manage growth opportunities, improve performance and mitigate risk. Headquartered in Irvine, Calif., CoreLogic operates in North America, Western Europe and Asia Pacific. For more information, please visitwww.corelogic.com.
CORELOGIC and the CoreLogic logo are trademarks of CoreLogic, Inc. and/or its subsidiaries. All other trademarks are the property of their respective owners.
Contact
For more information, please email Robin Wachner at [email protected]
For sales inquiries, please visit https://www.corelogic.com/support/sales-contact/
© 2023 CoreLogic,Inc., All rights reserved.


